  • 238 Product updates

Filter by Topic

Product Release Spotlight - June 2024 Release

Product Release Spotlight - June 2024 Release

Hi everyone! 👋The next major Cognite Data Fusion product release is soon approaching on June 4th. We’re excited to announce lots of new upcoming features across our Industrial Tools and Data Operations capabilities. This post will walk you through selected highlights from the release, including:INDUSTRIAL TOOLS Cognite Search | comprehensive data exploration for industrial users Industrial Canvas | collaborative troubleshooting and analysis Charts | no-code time series monitoring Charts | data quality indicators (beta) Fusion Landing Page | workspaces InField | customizable field observations (beta) InField | mobile data explorer InRobot | offline robotic mission planning (beta) Maintain | enhanced activity sequencing (beta) Maintain | shift support (beta) Streamlit | low-code applications (beta) DATA OPERATIONS Auth & Access Management | simplified user management 3D | contextualization and configuration enhancements Extractors | Kafka hosted extractor (beta) Data Workflows | data orchestration API Time Series | data quality status codes Time Series | improved data point queries (beta) These, and much more, can be found in our latest release notes. Check out all the additional features and improvements which will enable your teams to drive even more value from Cognite Data Fusion. We also recommend watching the June Spotlight video:   These new capabilities will be available to you on June 4th 2024. We would love to hear your feedback here on Cognite Hub over the coming weeks. We also want to thank all our community members for your contributions so far. We're eager to continue this collaborative process with you, seeking your valuable input on both existing and upcoming product features. We encourage you to continue to submit your Product Ideas here in the community, to help us understand how we can continue to evolve Cognite Data Fusion to fit your needs. Let's keep this momentum going! INDUSTRIAL TOOLS Cognite Search | comprehensive data exploration for industrial usersOfficial launch of Cognite Search. A streamlined search and data exploration for industrial users. This first major release includes sorting search results by properties, adjusting visible columns in search results, and allowing admins to set default filter combinations for all users. Additionally, the Location (Site) configuration now supports subtree and external ID prefix filtering. These updates simplify data exploration across the portfolio, making it more accessible for industrial users.In the 3D search experience, we’ve also released tools for measuring multipoints, areas, and volumes, as well as rules that trigger color changes on contextualized objects when specific criteria are met. These improvements offer better spatial awareness through advanced measurements and real-time visual alerts, significantly boosting operational efficiency and decision-making. Read more about it here  Industrial Canvas | collaborative troubleshooting and analysisOfficial launch of Industrial Canvas, a powerful tool designed to streamline collaboration on industrial data, allows users to integrate assets, time series, 3D models, and more into an infinite canvas. It includes markups, shapes, lines, versioning, canvas locking, commenting, and sharing capabilities, all with enhanced performance and interactivity. By enabling direct collaboration on contextual OT, IT, and ET data, Industrial Canvas facilitates quicker, higher-quality decisions and reduces the time spent on data collaboration, allowing more focus on production improvements.Read more about it here Charts | no-code time series monitoringOfficial launch of monitoring in Cognite Charts, replacing traditionally a time-consuming task for automation engineers. Users can now easily create thresholds on time series and set up alerts to get notified when these thresholds are breached. These enhancements reduce the burden of setting up monitoring, allowing anyone to monitor time series data. The alert system ensures proactive investigation when key equipment indicators deviate, improving overall efficiency and responsiveness.Read more about it here Charts | data quality indicators (beta)View time series data quality codes in Cognite Charts, such as “Bad” and “Uncertain”, on both raw and aggregated data points. Additionally, the raw data point limit has been increased to 100,000, and there is improved indication of gaps in calculations when dealing with bad or uncertain data. These updates enable users to trust the data they see, enhancing confidence in their decision-making processes and reducing the need to revert to source systems.Read more about it here Fusion Landing Page | workspacesPersona-based workspaces tailored specifically for Industrial Users and Data Managers address the previous challenge of a mixed interface. This update includes a revamped sidebar and home page, making it easier for users to find the tools and information they need right from the start. The new design simplifies onboarding for both Industrial and Data Expert users and lays the groundwork for future more personalized landing pages. InField | customizable field observations (beta)Configurable observations fit into field workers specific workflows. Ability to create Observations directly from their desktops, and use improved filtering and search capabilities. These enhancements make it easier to review media and discover high-critical findings. By customizing Observations to field workflows, users can ensure better actions and quickly address important issues, improving quality of data from the field, increase overall efficiency and reduce response times. InField | mobile data explorerOfficial launch of a mobile-only "Search" landing page improves access to relevant data in the field, addressing the issue of siloed information across different source systems. Field workers can now configure various InField workflows, such as observations and checklists, enabling or disabling them as needed. This update provides instant access to crucial data, offering a simple yet scalable solution for field workers. It simplifies deployment and can be expanded to accommodate additional workflows over time, enhancing overall efficiency and troubleshooting capabilities. InRobot | offline robotic mission planning (beta)Plan and create robotic missions offline using digital twins and contextualized 360 images, addressing the high costs and deployment delays associated with manual operator rounds. This feature enables users to define tasks and camera positions based on visual data, allowing the entire robotic mission to be prepared in advance. Once the robot is onsite, it can execute recurrent missions without any additional configuration, streamlining operations and reducing setup time. Maintain | enhanced activity sequencing (beta)Automated sequencing for activities based on defined dependencies and constraints, such as shift duration, day or night work, and overlapping activities, addresses the inefficiencies of manual and Excel-based resource estimation for shutdowns or maintenance campaigns. Users can now gather sets of work orders into multiple sequences and toggle them on and off to observe their impact on the tradematrix. These features improve resource planning, reduce execution delays, and eliminate the cumbersome manual work of creating work order sequences and corresponding tradematrixes. Maintain | shift support (beta)Enhanced Gantt functionality displays both day and night shifts within a single day, along with the corresponding tradematrix for each shift. This update addresses the previous limitation in Maintain, which made it difficult to assess plans involving multiple shifts within the same day. By providing a clear view of resourcing needs for both shifts, this feature improves resource planning, reduces execution delays, and eliminates the need for manual Excel work to create work order sequences and corresponding tradematrixes. Streamlit | low-code applications (beta)Users can now build low-code applications in Python using the Streamlit framework, simplifying the process of deploying applications. This capability addresses the time-consuming need for IT approval and hosting infrastructure. Users can now instantly deploy applications, making them accessible to non-coders. By lowering the burden of app development for citizen developers, this accelerates innovation and decreases the time required to share new solutions within their organization. DATA OPERATIONS Auth & Access Management | simplified user managementCDF admins can now manage user access by adding users directly to groups within CDF, bypassing the need for often time-consuming approval processes . Additionally, admins can create a "default" access group for new users. This update eliminates delays, minimizes errors, and reduces the burden on internal approval processes, ensuring a smoother and more efficient onboarding process. As a result, new users experience a better first-time use of the product.Read more about it here 3D | contextualization and configuration enhancementsNew 3D Scene Configurator aligns all 3D data correctly in relation to each other, addressing the challenge of viewing different models representing the same location together in one view. This improvement simplifies workflows and ensures accurate spatial relationships, providing a more immersive and precise representation of real-world environments for decision-makers in Cognite’s Industrial Tools or 3rd party applications developed with Reveal.Read more about it here Extractors | Kafka hosted extractor (beta)Support for Kafka messages as a hosted extractor eliminates the need for custom extractor development and deployment. This new extraction method allows users to connect to a Kafka broker and subscribe to a single topic directly. By supporting this popular event streaming protocol, the update provides instant connectivity, removing the need for downloading and installing extractors, and significantly streamlines the process for clients already using Apache Kafka.Read more about it here Data Workflows | data orchestration APIOfficial launch of the Data Workflows API allows users to orchestrate workflows that consist of Transformations, Functions, and CDF requests, along with their interdependencies. This update addresses the challenges of fragile pipelines, stale data, and difficulties in monitoring and scaling. By enabling the orchestration and monitoring of these workflows, users can minimize the effort required to manage data processes, significantly enhance the robustness and performance of data pipelines, and gain comprehensive observability of end-to-end pipelines rather than just individual processes.Read more about it here Time Series | data quality status codesRepresentation of time series data quality is now based on OPC UA standard status codes. This feature addresses the issue of users having to assume gaps in time series data are due to bad quality. By clearly indicating the quality status of each data point, users gain increased trust in the data. They can also choose how to treat good, bad, and uncertain data points in their calculations, preventing the automated removal of low-quality data during onboarding and ensuring more reliable data analysis.Read more about it here Time Series | improved data point queries (beta)Enhanced capabilities for retrieving data points and aggregates address the need for convenient time series data point queries. Users can retrieve data points based on a named time zone or specified time offsets in 15-minute increments. Additionally, data point aggregates can be obtained using Gregorian calendar units such as days, weeks, months, quarters, and years. This feature increases developer speed by providing a convenient API for data retrieval and improves the accuracy of queries by reducing the likelihood of code errors.Read more about it here 

Related products:InFieldMaintainIndustrial CanvasChartsSearch UIREST APIExtractorsData Workflows3DAccess & Group ManagementQuarterly Product ReleaseData Explorer
Industrial Canvas - Share canvas with your colleagues using their email addresses
Search, Data Exploration and Industrial Canvas │ New Features

Search, Data Exploration and Industrial Canvas │ New Features

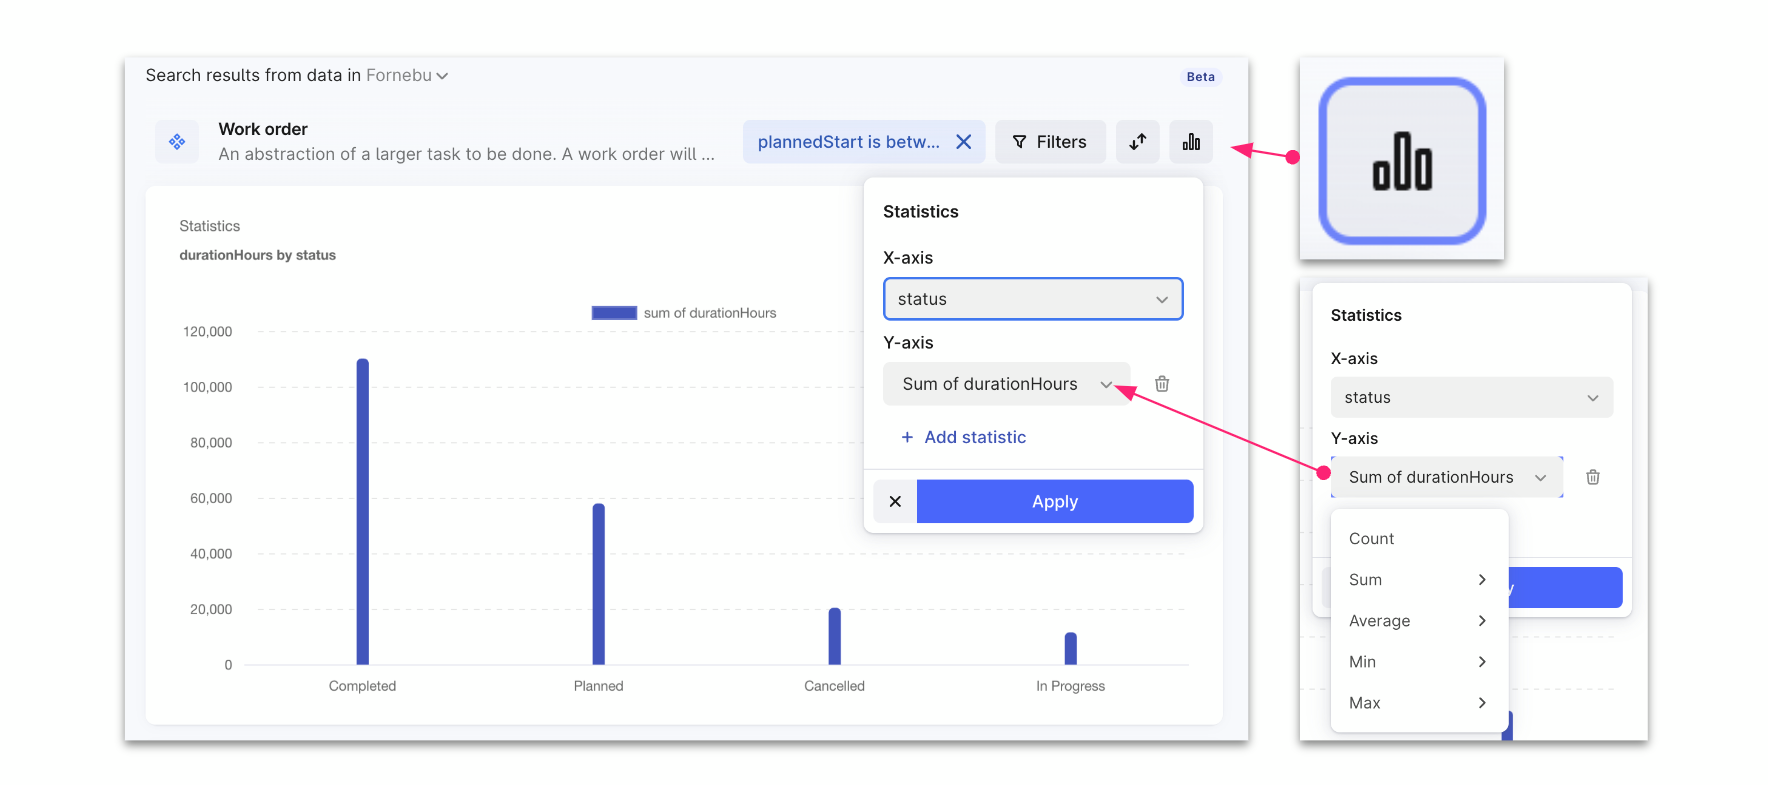
Hi everyone! 👋Today we released a range of new functionality, improvements, and bug fixes in both Industrial data search, Data Explorer and Industrial Canvas. Thank you to all who have provided feedback and posted suggestions to us here on Hub - many of you will recognize your feedback incorporated into what gets released today.  Industrial data searchOur focus since the March release has been around incremental improvements, fine-tuning some interactions, tidying up the user experience, and in parallel, working on some bigger customization functionality that we will release at the end of Q2. For today, we want to share with you this;  We have added sorting of search results to make it easier and quicker to find relevant data. You can now sort data (ascending/descending) throughout the user interface. The list of categories can be sorted on name or count it contains The list of search results can be sorted on all properties of the category Left: Sorting on Categories. Right: Sorting on Properties. The list of categories has gotten a face-lift with a default max number of categories shown, and a “show more” option if the number of categories is high.  The filters and search queries added as part of your exploration journey are now preserved during your user session to ease the exploration experience. When you start from the list of search results, you can now add filters and/or a search to filter down the list of result, dig into the filtered data, and be able to return to the list of filtered search without the need for going through the filtering steps again.  A new Statistics functionality has been added, enabling you to swiftly create visualizations of your data. This feature lets you categorize data based on specific properties and visualize aggregated metrics such as counts and averages. Please note, however, that the Statistics functionality is not supported for all data categories - you can use this feature for the categories listed under Other categories in the left hand sidebar.  The Statistics functionality can be used to create visualizations of you data.Our AI Copilot has been further integrated into the search functionality, streamlining the process of identifying categories and creating filters through conversational language. When you know chose to use the Copilot, you will the results appearing in the same interface as when you perform regular search. Additionally, the Copilot is equipped to autogenerate visualizations of statistics, further enriching your data exploration experience. You still trigger the Copilot the same way as before, choosing “Ask Copilot..”. AI Copilot is now more integrated into the Search experience.Some smaller bug fixes include increasing the portion of text we show (like for descriptions), and showing the label name instead of the label ID (thank you for reporting this!) Industrial CanvasToday we have released an improvement to the experience for finding and adding data to a canvas, by unifying the experience with the Industrial data search. When clicking “Add data” you’ll now recognize the experience from Industrial data search, which gives a more visual way of browsing your data, before adding it to the canvas.You recognize how the experience of finding and adding data to your Canvas is unified with the Industrial data search experience.Data ExplorerThere are two main improvements released today, both a result of feedback received from you here on Hub.  To ease and speed up data exploration, we are now preserving the applied filter(s) and search query while you browse in the details mode (they are reset when you exit the details mode). When you apply filter(s) and/or Search query in details mode, these are preserved while you are exploring data  We have made some adjustments to filtering logic in the common filters. In the Metadata filter, you’ll find that there are several keys, each typically having several values each. If you select several values for the same key, these are treated with the OR operation, while between keys we now apply the AND operation. Examples:  In the Metadata filter, you select the key “network level”, and two values. This selection is treated as: network level = production_subsystem OR production_system.  If you select another key in addition, this selection is treated with the AND operation: network level = production_subsystem OR production_system AND product_type = Gross. Combining the Metadata filter with other common or resource-specific filters is treated with the AND operation. Here we have applied the filters: network level = production_subsystem OR production_system AND product_type = Gross Let us know if you have questions or feedback!Best, Sofie Berge, on behalf of Cognite Product Management

Related products:Industrial CanvasSearch UIData Explorer

Charts Updates and New Features

Hei Everyone! We're excited to announce the latest updates to Charts, designed to enhance your data visualization and analysis experience. In this release, we've focused on improving data viewing capabilities, introducing new features for better visual analysis, and enhancing monitoring job setup and validation. These enhancements are aimed at providing users with greater flexibility, control, and confidence in leveraging Charts for their data-driven decisions. a) Improved Chart Data Viewing and Trust in the data viewed - Increased the maximum number of raw data points viewable in a chart from 500 to 100,000.- Aggregate min/max shading is now enabled by default when switching to aggregate data. This substantial increase in data points allows for a more comprehensive analysis of data trends in RAW mode without the need to switch to aggregated views prematurely. This min / max shading being on by default should ensure that users are better aware of when they are viewing aggregated data. We hope that these changes should help build better trust in Charts and make the data look more similar to what is viewed in PI systems. b) Slider/Marker Functionality in Charts: - Users can set and delete multiple sliders/markers to compare values across various points in a time series. With this new functionality, users gain the ability to freeze values at specific points in time within a given chart. By setting multiple sliders/markers, users can effectively compare data values across different time series, enabling deeper insights into data trends and patterns. c) Backfilling of Monitoring Jobs - Receive a count of alerts that would have been triggered within the specified time frame when setting up a monitoring job   With this latest enhancement, users can now conduct historical runs of monitoring jobs before finalizing their configurations. Upon setting up a monitoring job, users will receive valuable insights into the number of alerts that would have been triggered within the specified time frame based on the configured thresholds. This functionality not only allows users to verify the effectiveness of their threshold values but also helps prevent the potential spamming of alerts by ensuring that thresholds are set at reasonable levels.  

Related products:Charts
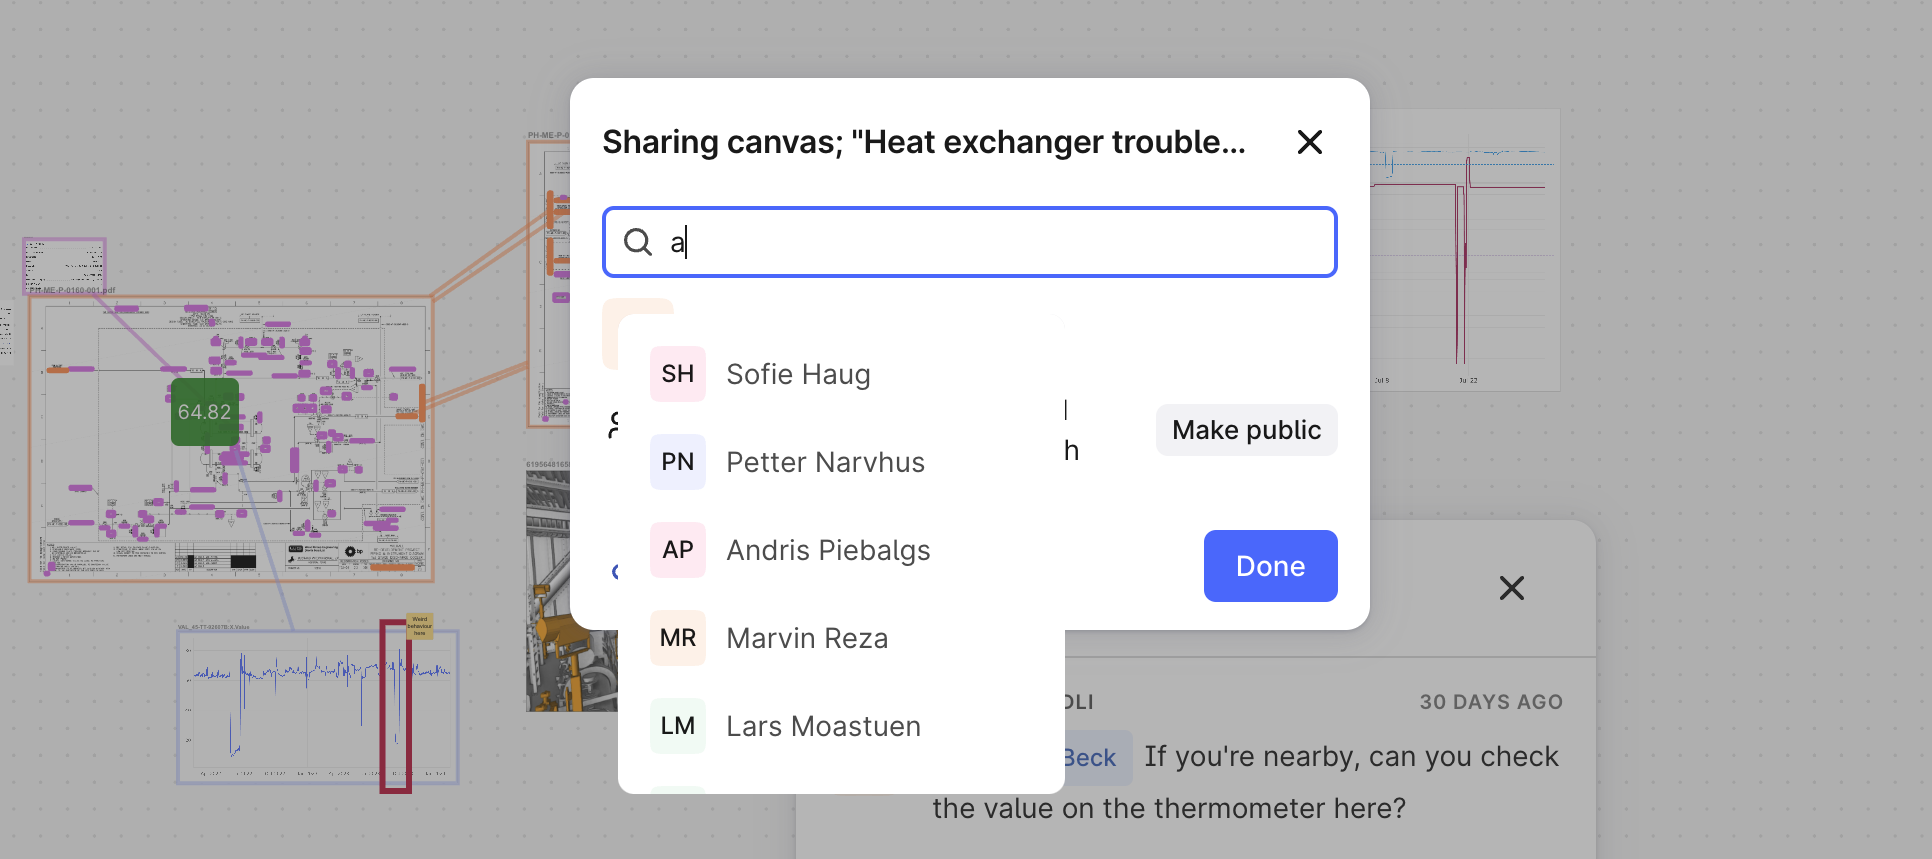
Industrial Canvas - Share canvases with your colleagues
Product Release Spotlight - January 2024 Release │ Cognite Data Fusion

Product Release Spotlight - January 2024 Release │ Cognite Data Fusion

New year - New release! Welcome to 2024, the year that brings easy accessibility and seamless utilization of complex industrial data, thanks to the power of Generative AI.   Easier to get started with the new landing page on Cognite Data Fusion Finding data for industrial users is now vastly improved in the new search experience (including both (F)DM and Asset Centric) Engineers doing collaborative troubleshooting and root cause analysis are supercharged by key features requested by our core users in Industrial Canvas In direct response to your feedback, we’ve improved monitoring of equipment and processes with editing, highlighting and more context in alert emails And finally for all industrial users, first class Units support! And that’s not all, there’s much more to explore and discover. Dive into the latest release and uncover all the additional features and improvements designed to take your industrial data journey to new heights. These brand new additions will be available to you on January 9th 2024. We would love to hear your feedback here on Cognite Hub over the coming weeks. We also want to thank all our community members for your contributions so far. We're eager to continue this collaborative process with you, seeking your valuable input on both existing and upcoming product features. We encourage you to continue to submit your Product Ideas here on the community, to help us understand we can continue to tailor Cognite Data Fusion to your needs. Let's keep this momentum going! Here’s a short video summarizing the exciting updates  Easier to get started with the new landing page on Cognite Data Fusion Working in critical roles we know how important it is to get started fast, and get straight to work. This is why we are launching a new, focused landing page for Cogniter Data Fusion with quick access to Search, Industrial Canvas and Charts. Your most recent work is highlighted for you to get right back where you left off. All of your powerful features of Cognite Data Fusion are available in the menu, with quick access to what you need.  Finding data for industrial users is now vastly improved in the new Search experience With the launch of the brand new Industrial data search experience we are simplifying how you can search, browse and find your industrial data across different types of data. Search and browse across 3D, sensor data, equipment, documents, work orders and more, all in one place. The refreshed experience is optimized for industrial end users looking for quick answers across complex data. This includes built in Generative AI search where you can use natural language to get simple answers to complex questions powered by your industrial knowledge graph.   Supercharge your visual troubleshooting with Industrial Canvas When troubleshooting complex issues, most time is spent on finding the right data and sharing it across disciplines. Collaborating in a visual, seamless way reduces the time and effort to resolve issues and get your systems back to optimal performance. With this release we are introducing more control when collaborating visually in Industrial Canvas. You can lock down root cause analyses to prevent changes after an issue is resolved. You can also roll back to earlier versions of an analysis through automatic snapshots of your work. Enrich your P&IDs and technical documents with a built in symbol library, and export all markups as PDF.Here you will also be guided by Generative AI, where all documents can be summarized and interrogated for questions. Long, technical documents can give you structures answers to your questions, with references to where in the document the answer was extracted. Improved Monitoring of equipment and processes When monitoring critical equipment and processes, you now get more relevant context and information in alerts emails. You can jump straight into the relevant chart and start troubleshooting, or unsubscribe directly from the email. You also have the ability to edit and tune your parameters of ongoing monitoring jobs, improving the overall workflow of monitoring your plant.  First class Units support Across our APIs and Python and Javascript SDKs we now have full support for industrial units through our Cognite Unit Library. All features and examples are described in our documentation and examples.You can find more detailed information on the updates in the release notes on our Documentation portal. 

Related products:Industrial CanvasSearch UIQuarterly Product Release

Deprecation Notice for AIR and Introduction of New Monitoring Capabilities in Cognite Charts

Hi CDF Users,This is a reminder notice for the deprecation of AIR. The alpha-level maturity monitoring solution AIR will be deprecated on 2023/12/31 and we will no longer provide support for the AIR after this date.To ensure a seamless transition and to provide you with improved monitoring capabilities, we are excited to introduce our new solution in Charts which is in open beta and is now available to all customers.Key Features of Monitoring in Charts:Enhanced User Experience: Monitoring in Charts has a better user interface, providing a user-friendly experience for proactive troubleshooting and root cause analysis. Integration with No Code Calculations: Our new solution allows for effortless integration with no code calculations, streamlining the monitoring process and empowering users to derive insights without the need for extensive coding.Stability and Reliability: Monitoring in Charts is built with stability and reliability in mind.Scalability: Monitoring in Charts is built on a backend API that is better suited for scaling making it an overall better solution instead of AIR as your monitoring needs grow. We believe that the transition to Charts will bring significant benefits to your monitoring needs. We appreciate your understanding and look forward to continuing our partnership with you as we embark on this exciting new chapter in monitoring capabilities within CDF.  

Related products:Charts

Product Release Spotlight - October 2023 Release │ Cognite Data Fusion

We are excited to announce the October 2023 release of Cognite Data Fusion! This post covers some of the significant highlights of the release: Enhanced data exploration AI-powered data exploration Manual contextualization of 3D models Saving no-code calculations Monitoring asset health indicators Jupyter Notebooks with Cognite AI Copilot These enhancements will be made available on October 31, 2023. We would love to hear your feedback here on Cognite Hub over the coming weeks. You can also find more detailed release notes on our Documentation portal, as well as the October Roadmap update on Product Updates. This month, we focus on data onboarding. We also want to thank all our community members for your contributions so far. We're eager to continue this collaborative process with you, seeking your valuable input on both existing and upcoming product features. Let's keep this momentum going! Here’s a short video summarizing the exciting updates Enhanced data explorationWe are happy to share our newest enhancement to the search experience within Cognite Data Fusion, furthering our ambitions to deliver easy access to complex industrial data. This feature provides user-friendly search and enhanced context for industrial users, such as engineers, technical experts, and operational teams. You can narrow your search to a specific site - like an individual offshore asset or a processing facility - to make the search results more relevant. The search results are grouped and presented in an industrial context and can be viewed through a list view and a 3D view with a wide set of filter capabilities across all given data types. You can easily change between layered models to see CAD models, 360 images, and point cloud models.   AI-powered data explorationAs an advancement to traditional search and filtering of data models, users can now search using AI. You can toggle on AI and find data by using the example questions or write your own using natural language. You can at any time adjust the generated filters and also view the aggregates as charts and text summaries.   Manual contextualization of 3D models3D models such as CAD or laser scans don’t always contain the required information to link the model to assets, and current workflows require a fully contextualized 3D model to enable you to really benefit from the power of 3D. If you're adding 3D models to Cognite Data Fusion, you can now do manual contextualization of both CAD models and point cloud models in Cognite Data Fusion. The asset links can be reflected in all Cognite applications using the Reveal 3D viewer, enabling users to maximize value capture from applications such as InField and Maintain or any bespoke customer applications built with Cognite Reveal.  Saving no-code calculationsIf you're using CDF to create and run calculations, you can now create, save, and schedule the calculations in Charts. This eliminates the need to create Python scripts and deploy functions. The scheduled calculations can be consumed on external dashboards or used as input to advanced models.  Monitoring asset health indicatorsMonitoring asset health indicators and performance KPIs is one of the key jobs of engineers and subject matter experts when evaluating asset health. We’re now adding the ability to set up threshold-based monitoring in Charts, using raw time series or the saved no-code calculations. You can also enable email notifications to be sent out when thresholds are reached for the monitoring jobs.   Jupyter Notebook with AI copilotData scientists and data engineers can now work with and run Python scripts from Cognite Data Fusion without setting up infrastructure. This is a valuable tool when combining the power of Cognite Data Fusion with external tooling, such as data analytics packages, and when you need to enrich your data using custom logic. Notebooks run in a sandboxed environment inside the browser under the current user credentials, ensuring data integrity.We’re also introducing a code copilot integrated with Jupyter Notebook. By leveraging GenAI, the copilot will help you write and understand code. Code generated from natural language helps you get to value quicker by reducing the need to write boilerplate code or do advanced data analytics. We now support natural language data insights using large language models in notebooks. This allows you to ask questions about data retrieved from Cognite Data Fusion or to generate plots.  You can find the product documentation here Early adopter programsData workflows is a new managed process orchestration service within Cognite Data Fusion. Using CDF Workflows, you can orchestrate the order and timely execution of interdependent processes such as transformations, functions, requests to CDF, and dynamic tasks. The service is only available by joining the Early Adopter Program. Request participation through the group on Cognite Hub. Industrial data search enables industrial users without technical background to easily find relevant data. Search results show the industrial context with the ability to narrow down the search to a specific site/asset, and with several lenses/dimensions of searching and viewing data, such as via 3D, AI search, and standard search with list view and a range of filter capabilities. Please come and join us in the Early Adopter Program. Request participation through the group on Cognite Hub.

Related products:ChartsJupyter Notebooks3DAgent builderQuarterly Product Release

Product Release Spotlight - August 2023 Release │ Cognite Data Fusion

We are very excited to announce the August 2023 release of Cognite Data Fusion. This post covers the highlights of the release, which will be available to our customers on September 5th, and includes:  Infield - productivity and GenAI upgrades Maintain 2.0 - new version with improved collaboration, productivity, and visualization features Industrial Canvas - collaborative troubleshooting Extended language support across our user interfaces Power BI connectivity - data modeling support In addition, you can expect an updated version of the Cognite Data Fusion roadmap to be shared in September. The roadmap will provide you with an overview of our plans for the remainder of 2023 and well into the next year.We also want to thank all our community members for your instrumental role in shaping this release. Your contributions and collaborative efforts right here in the Product Ideas section on Cognite Hub have been vital in driving the development of our product. Thank you for being the driving force behind our continuous improvement journey! A short video summarizing the release  Infield - productivity and GenAI upgradesToday, field workers mostly use paper-based documents to perform their tasks and gather data, which is both time-consuming and often leads to the data not being captured in any digital format for re-use. Infield now offers creation of digitized checklists with increased flexibility and automation, with all data captured through the application made available in Cognite Data Fusion. This allows for re-use and improvement of data quality. We are also introducing a new Generative AI feature in Infield. You can now use AI to assist you in searching for information in documents, for instance an operating limit for a pump, and get the result in seconds instead of manually scrolling through tens of pages in manuals.AI powered document search & checklist creation in Infield Maintain 2.0 - improved collaboration, productivity, and visualizationPlanners meet several challenges in their everyday work, including collecting and keeping track of which data to use, finding opportunities to execute additional work orders, and optimizing the productivity of available resources. Maintain 2.0 offers users a significantly improved collaboration experience, including sharing and commenting functionality. To improve productivity, work orders can now be mapped to different grid areas in the two-dimensional layout diagrams, in addition to enhanced automation of creating plans. We are also introducing improvements on how to visualize activities, with the choice of highlighting them directly in the plan or Gantt chart itself, in two-dimensional layout diagrams, or 3D models representing the facility. A new overview of resource allocation over time will also help planners and coordinators in optimizing their plans. Sequencing of activities across different lenses in Maintain Industrial Canvas - collaborative troubleshootingThe Industrial Canvas is a no-code tool that revolutionizes data exploration and visualization. It is a collaborative and visual workspace to work across documents, engineering diagrams, sensor data, images, 3D models and more. It gives you simple access to complex industrial data, and allows you to troubleshoot, collaborate and act on insights across multiple disciplines. The latest addition to Industrial Canvas is that users now can leave comments and tag colleagues in the canvas they are working in, which triggers an email notification to the person being tagged. In addition, canvas visibility can now be set to either private or public. This allows you to work in a safer environment with colleagues when troubleshooting and performing root cause analysis, before ultimately opening up and sharing your findings with the broader organization.Commenting, user tagging, and sharing in Industrial Canvas Extended language supportOur most popular user interfaces, Charts, Industrial Canvas, Data Explorer, Maintain, and Infield, are now being made available in up to 10 languages. This will help our non-English language users with more effectively utilizing our product, contributing to faster onboarding and increased productivity. All users can select their preferred language by clicking on their profile in the upper right corner.Language selection in Infield Power BI connectivity - Data Modeling supportOur Power BI connector has been upgraded to now also include data from our recent Data Modeling feature. This enables users to load and filter data from their own customized data models, allowing for much richer and specific representations of their industry facilities, processes, and similar. This data can as before be used in the creation of Power BI dashboards and reports. Power BI dashboard using data from Data ModelingWe know many of you will find these updates useful and valuable. If you have any feedback or ideas, we’d love to hear from you right here on Cognite Hub!  You can find the documentation here 

Related products:InFieldMaintainIndustrial CanvasQuarterly Product Release

Product Release Spotlight - June 2023 Release │ Cognite Data Fusion

We are very excited to announce a brand new release of Cognite Data Fusion. This post covers the highlights of this release coming to our customers on June 20th, and guides you to where you can go to get more details. Please drop a question, start a conversation with peers or give us product ideas here in our community on Cognite Hub.A short video summarizing the release New landing page It can be overwhelming to get started when logging in to Cognite Data Fusion, given that a modern Industrial Data Cloud platform has so much to offer. With all the different possibilities of Cognite Data Fusion, you would prefer to start with a clean and simple landing page guiding you to what is relevant for you. The next time you visit, you will find recently opened tools and recent activities to jump right back in where you left off. This allows for easier onboarding, and useful resources such as documentation, online training courses, support and our community is easier to access.  Industrial CanvasFor early adopters we are introducing a powerful new capability in Cognite Data Fusion. The Industrial Canvas is a Generative AI powered, user-centric no-code tool that revolutionizes data exploration and visualization. A collaborative and visual workspace to work across documents, engineering diagrams, sensor data, images, 3D models and more. It gives you simple access to complex industrial data, and allows you to troubleshoot, collaborate and act on insights across multiple disciplines. A collaborative way of piecing the data together, into context, powered by the industrial knowledge graph.  Extensions to advanced data modelingTo realize the full value of the new data modeling capabilities that was released in April, you need them to extend to the wider ecosystem of Cognite Data Fusion. With this release we are making it easier to get started with out-of-the-box data models. The first one available is CFIHOS, which is an industry information standard that aims to standardize across both operators and equipment manufacturers and suppliers. You can also build operational dashboards and share insights based on powerful industrial data models through updated connector to Grafana. In addition we will start making native data exploration for these new data model capabilities limited available to selected customers.SAP extractorsERP data is an important source of data for solving asset heavy industrial problems, improving asset performance by integrating work orders, maintenance data, asset information etc. to your industrial knowledge graph. Creating and customizing connectors to SAP data can be time consuming and manual. This is why we have productized a robust SAP connector that is available for download and documentation through the Cognite Data Fusion user interface. It supports standard SAP OData interfaces as well as custom OData services built on SAP Gateway across all SAP modules.User profilesEnhanced collaboration in digital tools require that users have profiles where they can store basic information to allow advanced sharing, tagging, commenting and further collaboration features. In order to make this possible, Cognite is making user profiles available in Cognite Data Fusion, integrating with your Identity Provider, creating the foundation to enable advanced sharing and collaboration within the tools in Cognite Data Fusion.In-browser Jupyter Lite notebooks (Limited Availability)Getting started with coding on industrial data can be a big hurdle. Restrictive policies, lengthy setup and configuration including hosting, maintaining and updating over time. This is why we are launching for early adopters in-browser Jupyter Lite notebook Pre-authenticated to Cognite Data Fusion through the user interface. It will pre-load the latest SDK each time you log in, fast and convenient to get started with coding in one click. No time wasted setting up environments, loading SDKs or spending time on authentication. This will also ship with a set of  examples of typical use cases to get started.  We hope you find the updates useful and valuable. We’d love to hear your feedback in the comments! You can find the detailed documentation here

Related products:Industrial CanvasExtractorsData ModelingQuarterly Product Release

Cognite Data Fusion Release: April 2023

Spring is upon us, and another release of Cognite Data Fusion. We’re happy to share the details of the April release with you. Remember, you can always get in touch with us and the rest of the Cognite community here on Cognite Hub, share your ideas and stay up to date with the latest developments in our products. In addition, we can recommend the latest Cognite Product Tour video focusing on Asset Performance Management, and how Industrial DataOps and Cognite Data Fusion enables a new approach to optimizing the performance of your assets.  For the April release, we’re continuing the trend of improving how to find, explore and understand data in Cognite Data Fusion, and we’re also delighted to bring the new Data Modeling capabilities in Cognite Data Fusion to GA maturity, which means that we will be offering the same SLA and operational support for data models as we do for all other data stored in Cognite Data Fusion. Improvements to Search, navigation and 360 images in Data ExplorerBasic search capabilities in Cognite Data Fusion have now been improved, and all data stored in Cognite Data Fusion should now be searchable. Metadata, event types, document contents etc. are now all searchable. To make it easier to navigate the search results, we will show labels indicating why a particular result is shown, and are shipping several improvements to the filtering capabilities to make it easier to narrow down your search results. As always, nailing a search experience that fits every customer and set of data is no easy task, and we welcome your feedback and suggestions for improvements on Cognite Hub. We’re also upgrading the display of time series data in search results, and making it easier to open selected time series in Cognite Charts.  Complementing the data exploration release is an improvement in the performance and usability of 360 images in the Data Explorer. Large image sets caused performance issues and usability problems, and we have now shipped several improvements to make these more pleasant to work with. As always, the improvements here are also available in Cognite Reveal for use in your own applications.On the topic of Cognite Reveal, it is also worth noting that for this release, Cognite Reveal now supports textured 3D models, and is able to render these for an improved and more immersive and usable 3D experience. Please note that this feature does not target models with complex textures, such as photogrammetry models. It is necessary to re-upload old 3D models to Cognite Data Fusion to enable viewing of textured models.  Data Modeling - Generally AvailableWe’re delighted to make the new data modeling capabilities available with our standard SLA and support guarantees in this release. We’ve worked hard to iron out bugs and improve performance since February, and we think the current release is a major milestone in terms of making Cognite Data Fusion adaptable to a rich set of industry standards, representing data for a host of different use cases and making them easier to understand and use for all users and developers.The current release marks a big milestone for us in the maturity of this feature, but we are far from done. For June, we will be focusing on integrating the new data models fully into Cognite Data Fusion, shipping updates to the Data Explorer, Charting and Dashboarding, SDKs and connectors. In addition, you can expect the recommendations for how much data the Cognite Data Fusion can support in user-defined data models to grow steadily throughout the year. Expect a lot of exciting improvements in the time to come, and make sure to subscribe to Cognite Hub for the latest news on the developments.To complement the GA release of data modeling, we have also made a lot of improvements to how data is loaded into Cognite Data Fusion. Transformations are now easier to work with than before, and we are shipping an improved UI with automatically suggested mappings, improvements to the SQL editor and easier workflow for data transformations and mappings between data models.  Improvements to handling of P&ID diagramsP&IDs are a staple of industrial data, and this time we are shipping two improvements to how Cognite Data Fusion handles these. The contextualization capabilities for P&IDs have been improved to handle common shorthands for multiple references to tags, improving the accuracy of contextualization. To complement our search capabilities we are also shipping an automatic document classifier for P&IDs - based on machine learning on large amounts of diagrams, this classifier is able to accurately label P&ID diagrams in a wide variety of formats. This allows you to more easily filter search results and find the right diagrams across all relevant file formats.We hope you find some of these updates useful and valuable. If you have any feedback or ideas, we’d love to hear from you right here on Cognite Hub.  You can find the detailed documentation here 

Related products:Search UIDiagram ParsingData ModelingQuarterly Product Release

Asset Performance Management Release - Cognite Maintain: February 2023

What is the Cognite Asset Performance Management (APM) portfolio?Cognite Asset Performance Management addresses common business problems faced in the asset-heavy industry, such as aging assets and workforce, increasing maintenance costs, and unplanned downtime. Cognite InField, Cognite Maintain, and Cognite InRobot are workflow applications in this portfolio. Read more about Cognite Asset Performance Management (APM) portfolio here.  What’s new in Cognite MaintainBuilt on Cognite Data Fusion, Maintain provides performant contextualized data and a modern interface for your maintenance  planning and scheduling processes. Cognite Maintain is  a planning tool initially created to plan maintenance work orders. The new version of Cognite Maintain helps you plan and optimize plans with any type of activity. Here's a list of the new Cognite Maintain features currently being worked on: Prioritize your backlog Group, filter, and sort activities to show what is important across the multiple lenses. Save your layouts, such as your preferred filter, grouping, and the data you want to show in Maintain Visualize the grouped data  in the Gantt chart to see timelines across all activities. Plan Creation and Optimization   Create plans tailored to a set of activities. For example:  Plans by discipline Plans by a timeframe Plans by location     Use the comparison module compare the activities in a plan to: Activities that occur in the same timeframe All activities in the backlog The comparison module can be used across lenses, such as 3D, 2D, and in the standard Gantt chart/table view.The System level mapping feature  shows how equipment is connected. You can, for instance, use this to find out if other activities related to a system will be affected due to work on a piece of equipment.In addition, you can use the Plan Analysis, and Resource Allocation to determine whether a plan is feasible or not according to your resource constraints. Work preparation and executionWhen you’ve created  a plan, you must make sure that you have all the necessary work preparations done and that the activities are ready for execution: Use the  canvas to see and open all the documents needed for an activity Create isolation boundaries by utilizing the annotation feature in the canvas mode Find the material status for an activity View the site in 3D to make sure you are ready to execute the activity We will shortly announce the release date for Maintain 2.0. Let us know your thoughts in the comments:)   

Related products:Maintain

Asset Performance Management Release - Cognite InField: February 2023

What is the Cognite Asset Performance Management (APM) portfolio? Cognite Asset Performance Management addresses common business problems faced in the asset-heavy industry, such as aging assets and workforce, increasing maintenance costs, and unplanned downtime. Cognite InField, Cognite Maintain, and Cognite InRobot are workflow applications in this portfolio. Read more about Cognite Asset Performance Management (APM) portfolio here.  Built on Cognite Data Fusion®, InField equips your field workers for digital transformation. Cognite InField is built for execution of maintenance activities and operator rounds out in the field, enabling the field workers to be as efficient as possible by making relevant information available everywhere. Here's a list of the new Cognite InField features delivered in the last quarter.  New & improved 3D viewerLoading a 3D model is a heavy constraint on the InField machinery, and you've probably experienced a time lag when you open or navigate a 3D model. We've made substantial changes to the 3D code, and you'll now get much better performance when you open and search in a 3D model, both from a PC and a mobile unit.Turn on and off the new ghost mode option to grey out all the 3D geometry apart from the asset you're currently viewing. This is the only asset that will stay highlighted.Mark remaining task as…Use the new option Mark remaining tasks as... to set the same status for all tasks that haven't already been set with a status. You can do this for tasks within a checklist or a section. Select More options in the checklist or section header to find the menu item. You can also overwrite statuses already set on a task by selecting the checkbox Apply to all tasks in the checklist/section. You can, for instance, use this functionality if your system has a shutdown and you want to skip tasks planned for the shutdown period or if you've worked on all tasks within a section and want to set the same status on all in one go. You'll find this functionality both on a desktop and on a mobile unit.Updated help options and new E-learning courseYou can find more links to useful information under the Help menu.  The Cognite Academy has recently launched an InField e-learning course which is great for refreshing your InField knowledge and getting new ideas and inspiration on using InField. You can watch short videos and test your skills in a demo version of InField. We’d recoomend you to check it out!  

Related products:InField

Cognite Data Fusion Release: February 2023

Cognite Data Fusion Release: February 2023 We’re excited to share the highlights of the February 2023 release of Cognite Data Fusion. Continuing on the theme from the December release, we’ve made substantial improvements to searching and exploring data in Cognite Data Fusion. We’re also improving our support for document annotations, working with data transformations, and launching a major update of our enhanced data modeling features. For an overview of the release, watch the release spotlight video below.  Before we go into the details of the February release, remember that you can always post feedback and product ideas right here on Cognite Hub. We also recommend checking out our blog for the latest on the trends and thinking that are shaping the future trajectory of our product. Improvements to Data search, Document browsing, and 3D explorationIt's easier to apply filters to your search, filtering on multiple values within the same filter and combining multiple filters to narrow down your search. When you look at the search results, the results view is more customizable, offering you to select, sort, and change the layout of the columns displayed in the search results.When you’re viewing documents in Cognite Data Fusion, we’ve added support for a large range of common file formats, which now display natively in the document viewer. This includes text files, JSON files, spreadsheets, documents, and slides.  You’ll also find a new  option of laying out multiple documents in the same viewer. This is in particular useful when reading engineering diagrams, as these documents often break across pages or documents. Now, you can view them side-by-side to trace the flow of a connection. Using our contextualized engineering diagrams makes it trivial to open and view the next document from a connection exiting the page you are viewing and gives a holistic view of the system. Tip! These views can easily be bookmarked and shared with others to make recall and collaboration easier.Adding and consuming annotations enrich and power up the contents in engineering diagrams and other industry documents. We’re now shipping a unified Annotations API to make it easier to work with these annotations across all documents in Cognite Data Fusion. This will enable 3rd party applications to create and consume annotations, and the annotations will be visible inside Cognite Data Fusion. Over the next few months, we will transition all of our own applications to make use of this API, ensuring consistent views of documents across our entire product portfolio.The final major improvement made to data exploration in Cognite Data Fusion is to add support for viewing 360-degree images in the data explorer. You can view these images  in isolation or in the context of a point cloud or CAD/BIM model, providing a “street view”-experience where you can walk around your site or asset in high-fidelity imagery, making it easy to understand physical details and relationships without physically visiting the facility.  Connectivity improvements - Files and Energy data platformThis release sees the addition of improved connectivity for ingesting files into Cognite Data Fusion. Documents, diagrams, and files are almost always a key supplementary source of information to enrich and contextualize the digital twin in Cognite Data Fusion. Making it easier to ingest these makes it easier to leverage our new exploration and viewing capabilities. We’re now shipping a file extractor that supports local server file systems, several network sharing protocols, like FTP and SFTP, SharePoint, Google Cloud Storage, and Azure Blob storage. The extractor is easy to set up and automatically detects file formats and ensures the proper processing pipeline. We’re also shipping a public Beta version of an extractor for data platforms adhering to the OSDU Open Group specification. Commonly seen in the Energy sector, OSDU data platforms are a great initiative to standardize structure and formats for key data categories. Use the new Cognite OSDU extractor It is now easy to connect to and extract data from OSDU platforms to Cognite Data Fusion, where the data  can be further contextualized and blended into a richer industrial digital twin to enable new use cases and applications. Data transformation - Usability improvementsPreviously, setting up data transformations in Cognite Data Fusion required some knowledge of SQL to express the transformation logic. With the February release, we’re adding a simple drag and drop interface to set up simple mappings between properties without resorting to writing SQL code. You’ll’ get automated suggestions to simplify the mapping process. Writing full SQL is still possible, and the interface now supports auto-completion and numerous other tweaks to make this experience easier. Enhanced data modeling - Beta updateWe’ve written a lot about our new and enhanced data modeling capabilities. February sees us publish what we believe to be the last Beta update of this capability. Based on user feedback from Beta customers, and internal validation, we now think the February update is feature complete. What remains between now and the General Availability  release is additional testing, validation and hardening of the product to ensure we can consistently meet our SLA across the wide variety of use cases we will enable for you. Our enhanced data modeling capabilities allow you to model any kind of industry domain, from well-known industry standard data models to whatever you need to enable your applications and solutions. Read more about these capabilities in this press release.  Cognite InRobot Early Adopter ProgramWe are thrilled to announce we have launched the Cognite InRobot Early Adopter Program. Here you are invited to accelerate your robotics adoption to automate your work processes. You can find the group here, we hope you’ll request to join if this is of interest to you. InRobot is a powerful application that enables you to configure and deploy your robots in an efficient and effective manner. With InRobot, you have the ability to remotely control, plan, and execute a wide range of robotics missions, including the automatic capturing of street views, the execution of autonomous visual operator rounds, and capture data for monitoring conditions of equipment.You get the same benefits from robots using InRobot, like increased frequency and repetition of data capture at your site, in addition, to reduce the number of hours that workers spend in the field, thereby increasing the overall safety of your operations. With InRobot all data is properly linked in Cognite Data Fusion thereby enhancing your understanding your plant and potentially the risk picture. Read detailed documentation here We hope you find some of these updates useful and valuable. If you have any feedback or ideas, we’d love to hear from you right here on Cognite Hub.

Related products:Search UIData ModelingQuarterly Product ReleaseTransformations

Cognite Data Fusion Release: December 2022

The December 2022 release of Cognite Data Fusion contains major improvements in search and exploration of data, 3D and 360 degree image support, charting capabilities, and so much more. Keep reading, or watch the video for a full overview of what we’re delighted to bring you, just in time for Christmas.  Before we dive into the details of the December release, we also recommend our December 2023 Product Tour, where you can see a lot of the new features being demonstrated in real-world use cases. COGNITE DATA FUSION DECEMBER 2022 RELEASE IMPROVEMENTSImprovements to Data Search and ExplorationFinding the data you are looking for in Cognite Data Fusion can sometimes be hard. Based on your collective feedback, we have invested in making this experience a lot better, which comes together in the form of multiple improvements all targeted at making the job of finding the right data in Cognite Data Fusion as simple as possible.Global search is now available across all data types, and you can also search inside documents. When searching, we have added rich mechanisms to filter and sort your search results, making it easy to narrow down on the exact results you are looking for. The table view of search results has also seen an update, making it easier to customize the view and sort the results on different columns. In order to affect this change while ensuring operational stability, we will be enabling some of these features gradually per project over the coming weeks.To complement search and filtering, we have also added a lot of new 3D capabilities to the Data Explorer in Cognite Data Fusion. Using a 3D model to explore data allows you to leverage and understand physical locations and relationships of assets and equipment. We now ship a built-in full-screen 3D experience, where you can view contextualized data like documents, time series, events and images directly from the 3D model. The 3D viewer also supports slicing and measurements, allowing you to focus on the parts of the model you’re interested in, and also to understand the physical dimensions of the actual asset being shown.Easily find the data you need in context across 3D, documents, time series and events. The Data Exploration experience has also seen an overhaul of the user experience, based on your feedback and a desire to make finding data as simple as possible. You can expect further improvements in this area in the February release. Updated 3D capabilities, 360 degree images, point clouds, and moreThese new 3D capabilities are supported by our updated Cognite Reveal SDK, which is now released in version 4.0. It also brings support for 360 degree images, which allow you to create a “street view” like experience from traversing your 3D models, which can be a great way to complement a 3D model with immediately recognizable imagery from the actual site or asset. Support for point clouds is also available in the 4.0 update of Cognite Reveal, with improvements in rendering to make it easier to understand spatial relationships in a point cloud model. We have made it possible to isolate objects when rendering point clouds. This allows you to provide a rich experience when navigating a large point cloud model, adding isolation, color coding and interactive mechanisms for point cloud models. In addition to these major updates, Cognite Data Fusion also now provides native support for the Autodesk Navisworks NWD format. In total, these capabilities add up to providing great support for fully integrating 3D data into Cognite Data Fusion, and leveraging 3D and imagery when exploring data or building applications on top of Cognite Data Fusion. Cognite Charts integrated with Cognite Data Fusion, and event overlaysCognite Charts has been widely adopted by our customers, and has one of the most active communities of users. Previously, the integration between the other tools in the platform and Cognite Charts has been suboptimal: Cognite Charts had a separate URL requiring a separate login to access causing  unnecessary user friction. As part of our desire to make Cognite Data Fusion a great tool for simple access to complex industrial data, we are delighted to announce that we are bringing Cognite Charts into the main user interface. It is now available from fusion.cognite.com, no separate URL or login is required. This is a first step in bringing a better user experience across the entire product, integrating all of our main platform tools in one place. Charts also comes with a major feature update: you can now view Events in Cognite Data Fusion as overlays to a chart. Combining events and time series charts is often critical to understanding the correlations that are key to effective analysis and troubleshooting.  Make it easier to onboard data into Cognite Data FusionContinuing on a theme from past releases, we have made several improvements to the data extraction capabilities of Cognite Data Fusion. It is now possible to browse extractors by source systems - this allows you to find tailored components and recipes based on the actual source systems you are connecting to. To complement this, we will be investing in writing up more of our own experience and best practices when it comes to data onboarding, so stay tuned for more updates on this topic here on  Cognite Hub and our documentation.In addition, we added three extractors specific for well related data in the Oil & Gas sector: Cognite WITSML extractor, Cognite EDM extractor and Cognite Studio for Petrel extractor. This allows our users to withdraw data from highly used sources, and make it available through CDF to complete advanced well delivery workflows.  Data Management - Add Data Catalog to Cognite Data FusionA cornerstone of a scalable DataOps Platform is the ability to create, manage and monitor a large number of data products from the platform. With the upcoming general avail ability release of our Flexible Data Modeling capabilities, this will become even more important. To take the first steps in providing an improved data management experience, we have shipped the first iteration of a data catalog inside Cognite Data Fusion. Expect this service to mature into a more holistic offering for understanding, exploring and managing data products in the course of 2023. API & SDK Improvements, Japanese Language supportOur Python SDK has seen a major upgrade - the version 5.0 release focuses on performance improvements when accessing data points from many different time series, and brings functional parity between the Data Points API and the SDK. For most users, the 5.0 upgrade should be a drop-in replacement for the current version of the SDK.We have also added cursor support to the time series APIs - making it easier to navigate and retrieve large sets of time series data points, and bringing API parity with the other data retrieval APIs of CDF.Finally, some love for our Japanese users: Document search now ships with improved support for Japanese documents.We hope you find some of these updates useful and valuable. If you have any feedback or ideas, we’d love to hear from you right here on Cognite Hub. Stay tuned for more news and product updates as we move into 2023.Read the December Release Documentation    

Related products:ChartsSearch UIQuarterly Product Release

Cognite InField 10.17

Hello everyone! The InField team is happy to share that InField 10.17 is out now! 🎉In this version of InField, we introduce a few new features and improvements, so let’s jump straight into the good stuff! Filter columns in the revisions tableYou can now filter the different columns for work plans on the Revisions page to quickly find or hide work plans. Your InField admin can set this up in the InField configuration. Note that the Revisions page only appears if your source data comes from SAP. View parent-child asset hierarchyIf you're doing maintenance or inspection work and want to find equipment linked to the asset you're working with, you'll now find a parent-child hierarchy in InField. This functionality is available if you run InField from a desktop or a mobile device.Click the Search field on the Overview page to see equipment labeled with parent and children under the Hierarchy section. When you start to type in the Search field, the search result will appear at the top of the list, and the Hierarchy is moved to the bottom to bring focus to the search results. The new functionality is available on both desktop and mobileIf you're the InField admin, you'll find the settings for adding the filters under Work order by revision field mappings on the Work plans tab in the InField configuration in Cognite Data Fusion.  More area context in 3D models on mobile devicesIf you’re using InField on a handheld device, you'll now see more context of the surrounding areas around a tag when you view 3D models on a mobile device.On behalf of the InField team, we hope that you will enjoy this release – and feel free to reach out with any feedback you might have!Nicklas / Designer @ InFieldInField updates automatically to new releases, to make sure that you always have the latest and greatest version. Remember that you can always find the latest news about InField in our “What’s new?” section for InField on https://docs.cognite.com/infield/.

Related products:InField

Cognite InField 10.16.0

Another week, another InField update! InField 10.16.0 has just been released 🎉 This release introduces two new features: value ranges and alarm limits for time series, and additional input types for gauge readings!View value ranges and alarm limits for time seriesInField now displays value ranges and alarm limits for time series if this is set up in the source system that streams data into InField.You'll see the alarm limits as labels on time series on the Trends page and listed on the Properties card on the Overview page. The alarm limits are sorted as LL (Low, Low), L (Low), H (High), and HH (High, High). You can show or hide these values with the Show alarm limits button.The value range is displayed on the Time series card in the sidebar on the Trends page. Alarm limits and value ranges are available on both desktop and handheld devices.Notice the new labels with alarm limits and rangeAdditional input types for measurement readingsIf you're setting up or editing existing templates for routine round checklists, you'll find more options for how the checklist users can enter measurement readings. In addition to numbers, you can now set Low, Normal, High, or In, Out, Up as a measurement reading values: You'll also see that the checklists reports show these measurement readings in the Value column. We are always listening to your feedback, and we would love to hear how we can make these two new features even better – feel free to get in touch! 👍🏻In addition to these two new features, we’ve also removed invalid documents – documents that are set with workflow status Void or Superseded are no longer available in InField.Let’s end this release note with a quick InField tip! 💡 Did you know that you can open a checklist directly from a work order? Simply select an open work order, navigate to the “Objects” tab, and click the “Open as checklist” button.That has been it for now – on behalf of the entire InField team, we hope you enjoy using InField and have a great day out there 🚀 Nicklas / Designer @ InField InField updates automatically to new releases, to make sure that you always have the latest and greatest version. Remember that you can always find the latest news about InField in our “What’s new?” section for InField on https://docs.cognite.com/infield/.

Related products:InField

Cognite InField 10.15.5

Hello! It’s Nicklas from the InField team here to share a bit of good news: InField 10.15.5 has just been released 🎉Based on feedback from users of InField, our developers took some time to squash some pesky bugs with this version of InField. Two related bugs were causing problems for users on Apple iOS devices (such as iPads):Checklist items set to OK on an iOS device did not appear as complete when the items were synchronised with a desktop Checklist items added on an iOS device disappeared if you refreshed the page on the deviceIt took a bit of time to diagnose the cause of the issues, but we narrowed it down to connection issues between the iOS device and the InField database – they should now be fixed! A big thank you to our eagle-eyed and diligent users who reported these bugs! 👍🏻We also added a nifty little keyboard shortcut in this release. This update helps the users speed up the process of deleting multiple archived checklists by selecting a checklist under “Archived checklists” and pressing the Delete or Backspace key on the keyboard.Speaking of shortcuts, let’s end this release note with a quick InField tip! 💡 Did you know that you can set a task to OK just by holding down on the radio button for a second? It saves you a click!Feel free to let us know what you think about this latest release in the comment section below.On behalf of the entire InField team, we hope you enjoy using InField and ave a great day out there,Nicklas / Designer @ InFieldInField updates automatically to new releases, to make sure that you always have the latest and greatest version. Remember that you can always find the latest news about InField in our “What’s new?” section for InField on https://docs.cognite.com/infield/.

Related products:InField

Cognite Data Fusion Release: August 2022

Cognite Data Fusion (CDF) makes data do more. This release focuses on rapid, reusable, and scalable industrial data science by introducing new code and non-code solutions. Read more below or watch the videos to learn all about the improvement in this release. Cognite Charts​Cognite Charts is a graphical user interface that lets domain experts explore data and trends and perform troubleshooting and root cause analysis. No programming skills are required to use Cognite Charts. Read more Cognite FunctionsWith Cognite Functions, you can deploy and host Python code for additional calculations and models using the data in CDF. Cognite Functions offers Python functions as a service, reducing the effort and expertise needed to deploy solutions using CDF data. Model data in your programming language and according to your company or industry standards, then call the code on demand or schedule regular runs. You can deploy Cognite Functions using the Cognite API, the Cognite Python SDK, and the CDF user interface. Read more Improved Transform data page​CDF Transformations has a new user interface to guide you through the process of transforming data from the CDF staging area to the CDF data model. The new interface is fully backward compatible with existing transformations. Read more.Improved Extract data page​The improved Extract data page makes it easy to find your best fit extractor and the installation files. You'll also find links to the Cognite Python and .NET utils packages and SDKs to get started creating a custom extractor. Read more.Improved Explore data page​Files are grouped by their document type on the Files tab. The search bar is moved to the top of the page and displays the search results count on resource types. You can reset your filters, and a red badge indicates that filters are applied. You can also collapse the More filters section. We've improved the navigation when you search for a tag in an engineering diagram, such as a P&ID.New Annotations API​CDF can detect references to tags and assets in engineering diagrams, documents, and images. The detections are often called annotations. The new Annotations API introduces strict schema validation to avoid invalid annotations and a well-defined flow for suggesting, accepting, and rejecting annotations. The API also enables third-party applications to enrich documents in CDF with custom annotations. Read more.Ensure geospatial data integrity using data sets​The geospatial endpoint is the entry point for resource types enabling storing and querying item collections with a geospatial nature. You can now use data sets to document and track data lineage for the geospatial features and feature types. Read more.3D models​You can now upload 3D models in IFC open file format to CDF enabling using CDF to process and host Building Information Models (BIM). 

Related products:ChartsExtractorsFunctionsQuarterly Product Release

Cognite InField 10.12

This is an exciting release of InField that introduces the Sections feature for checklists based on templates.Sections make it possible to create neatly structured templates, routine round checklists, and checklist reports, with custom sections and subsections for logically grouped tasks.Checklist on desktop Checklist on mobile You can add sections and subsections to new and existing checklist templates if you're granted extended access rights to create templates. To create a section, click Create sections in the template creation view. Give the section a title, and move and indent checklist items that belong together below the section element. To create a subsection, drag and indent a new section directly below an existing section.Checklist items that don't belong to a group, you keep as is by placing them outside a section. You can format the section titles according to these guidelines. Select the Example button in the toolbar for inspiration for an example template with sections. FURTHER IMPROVEMENTSThis is the first version of creating checklist sections, and we'll continue delivering updates on this functionality based on your feedback. OPC UA time series dataStream OPC UA time series data directly from the control system to InField. On the Trends page and the Trends card on the Overview page, you'll see these time series labeled with OPC UA: View P&IDs on mobile unitsWe've learned that some users on some assets struggle to open P&IDs on mobile units. You may need to install a 3rd party file viewer for a particular P&ID document format on the mobile unit. Contact your organization's IT support for help with this.

Related products:InField