

 Check the
documentation
Check the
documentation Ask the
Community
Ask the
Community Take a look
at
Academy
Take a look
at
Academy Cognite
Status
Page
Cognite
Status
Page Contact
Cognite Support
Contact
Cognite Support
Hi everyone! 👋
Today we released a range of new functionality, improvements, and bug fixes in both Industrial data search, Data Explorer and Industrial Canvas. Thank you to all who have provided feedback and posted suggestions to us here on Hub - many of you will recognize your feedback incorporated into what gets released today.
Industrial data search
Our focus since the March release has been around incremental improvements, fine-tuning some interactions, tidying up the user experience, and in parallel, working on some bigger customization functionality that we will release at the end of Q2.
For today, we want to share with you this;
-
We have added sorting of search results to make it easier and quicker to find relevant data. You can now sort data (ascending/descending) throughout the user interface.
-
The list of categories can be sorted on name or count it contains
-
The list of search results can be sorted on all properties of the category
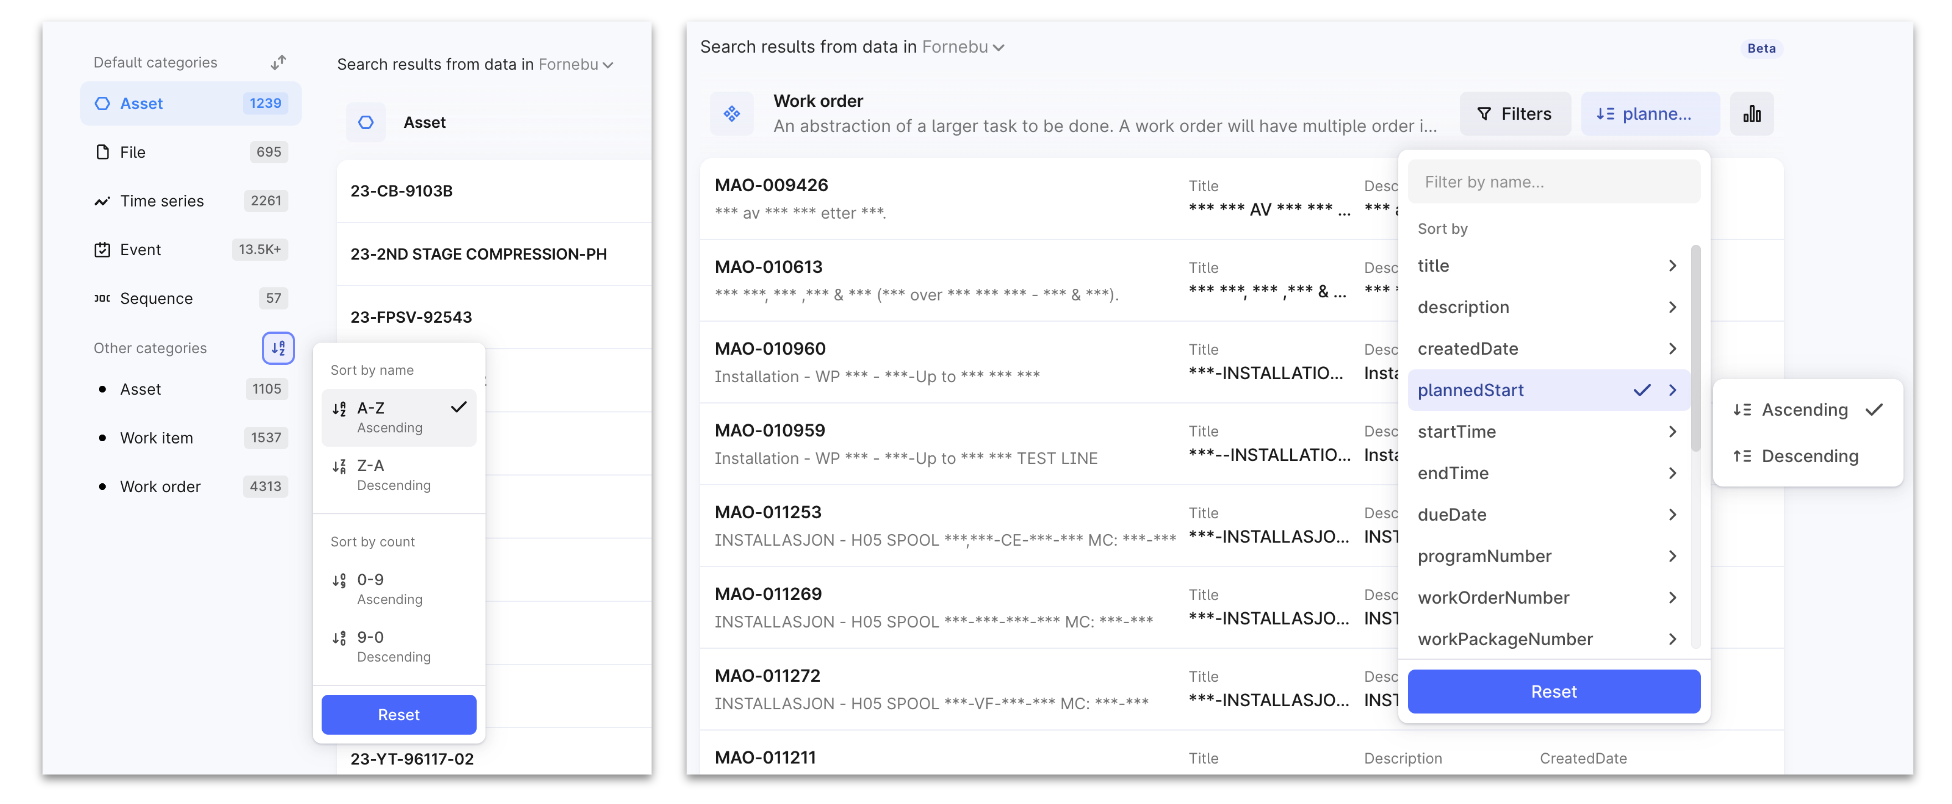
Left: Sorting on Categories. Right: Sorting on Properties. -
- The list of categories has gotten a face-lift with a default max number of categories shown, and a “show more” option if the number of categories is high.
-
The filters and search queries added as part of your exploration journey are now preserved during your user session to ease the exploration experience. When you start from the list of search results, you can now add filters and/or a search to filter down the list of result, dig into the filtered data, and be able to return to the list of filtered search without the need for going through the filtering steps again.
-
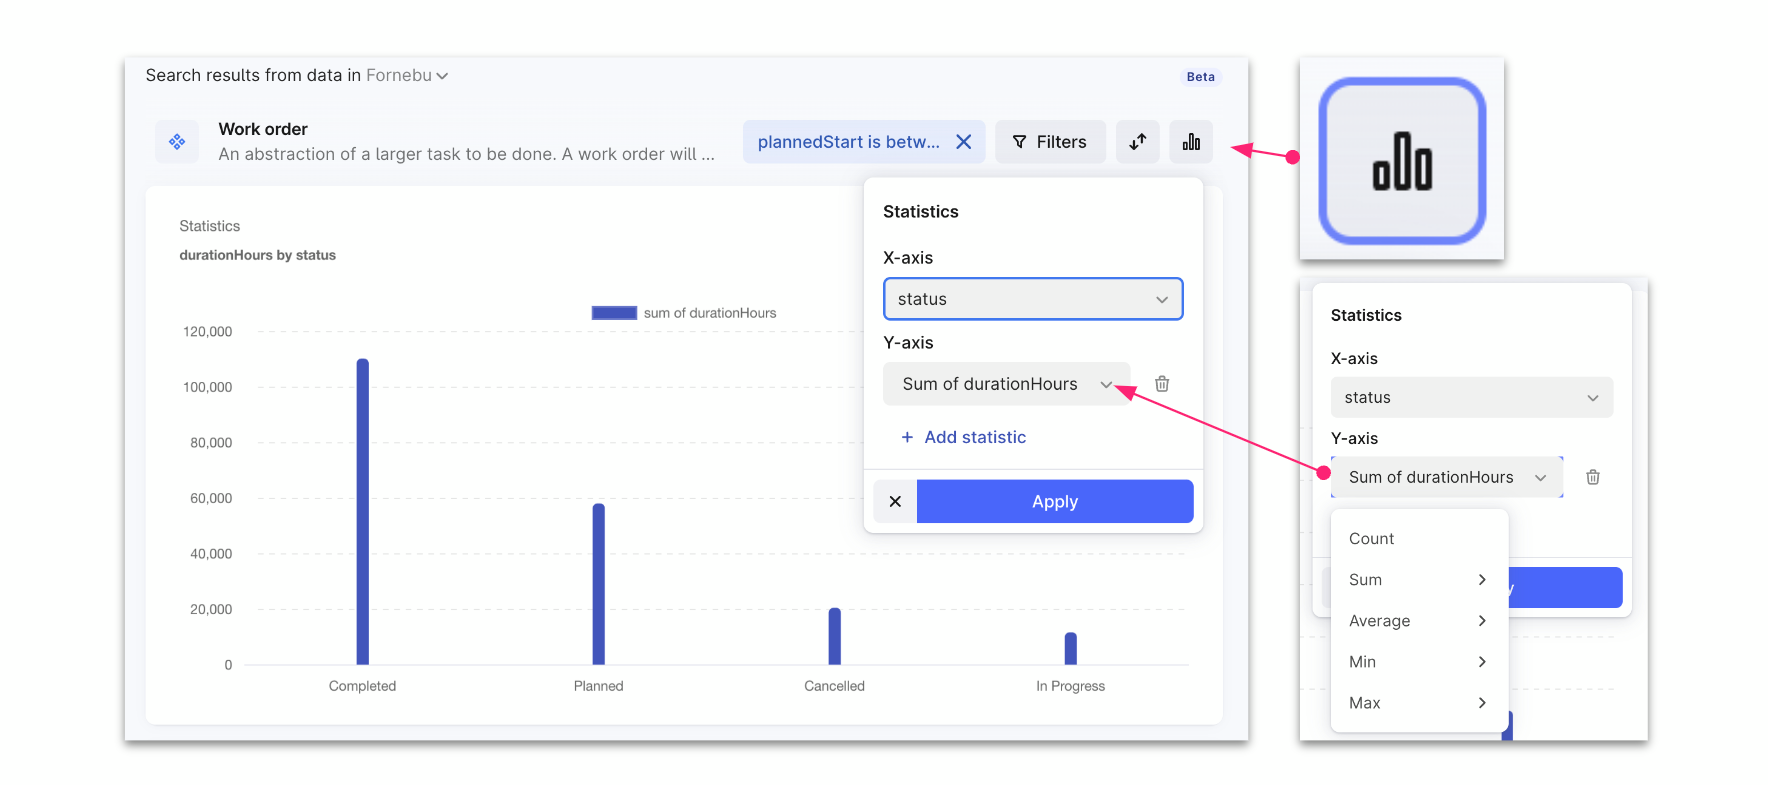
A new Statistics functionality has been added, enabling you to swiftly create visualizations of your data. This feature lets you categorize data based on specific properties and visualize aggregated metrics such as counts and averages. Please note, however, that the Statistics functionality is not supported for all data categories - you can use this feature for the categories listed under Other categories in the left hand sidebar.
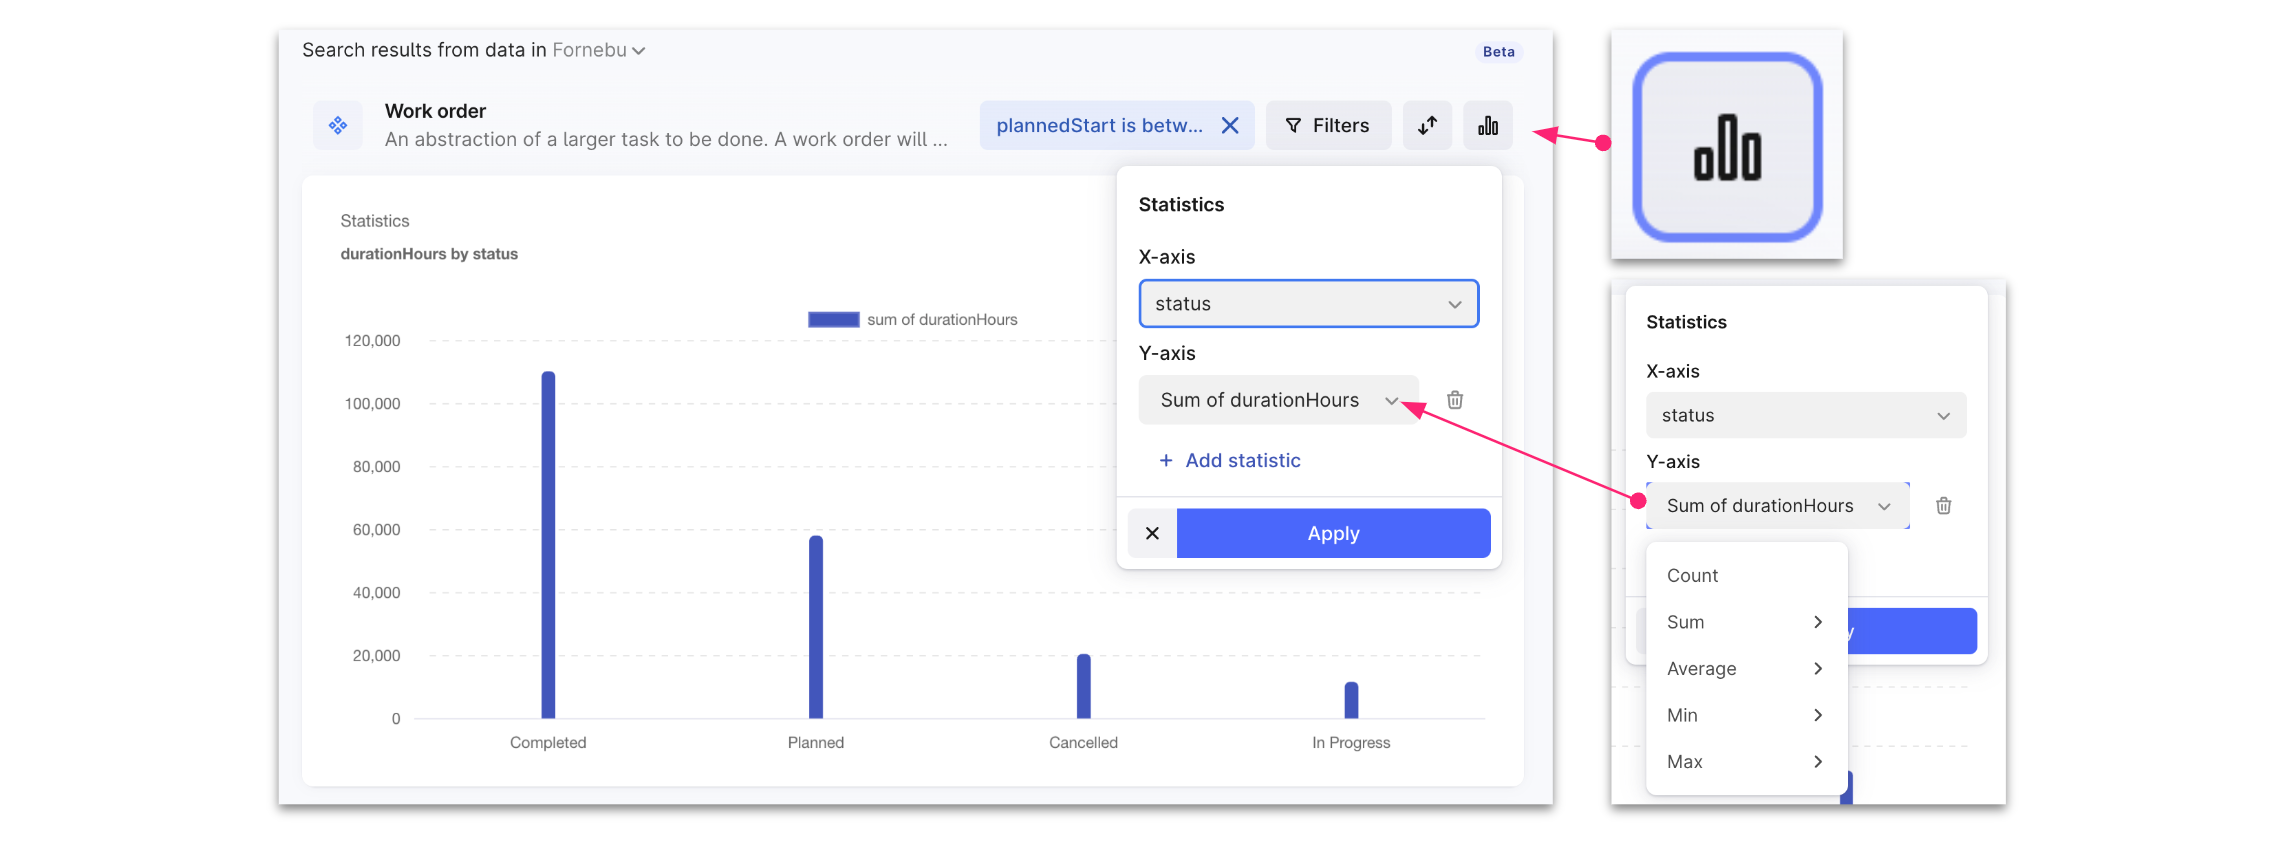
The Statistics functionality can be used to create visualizations of you data.
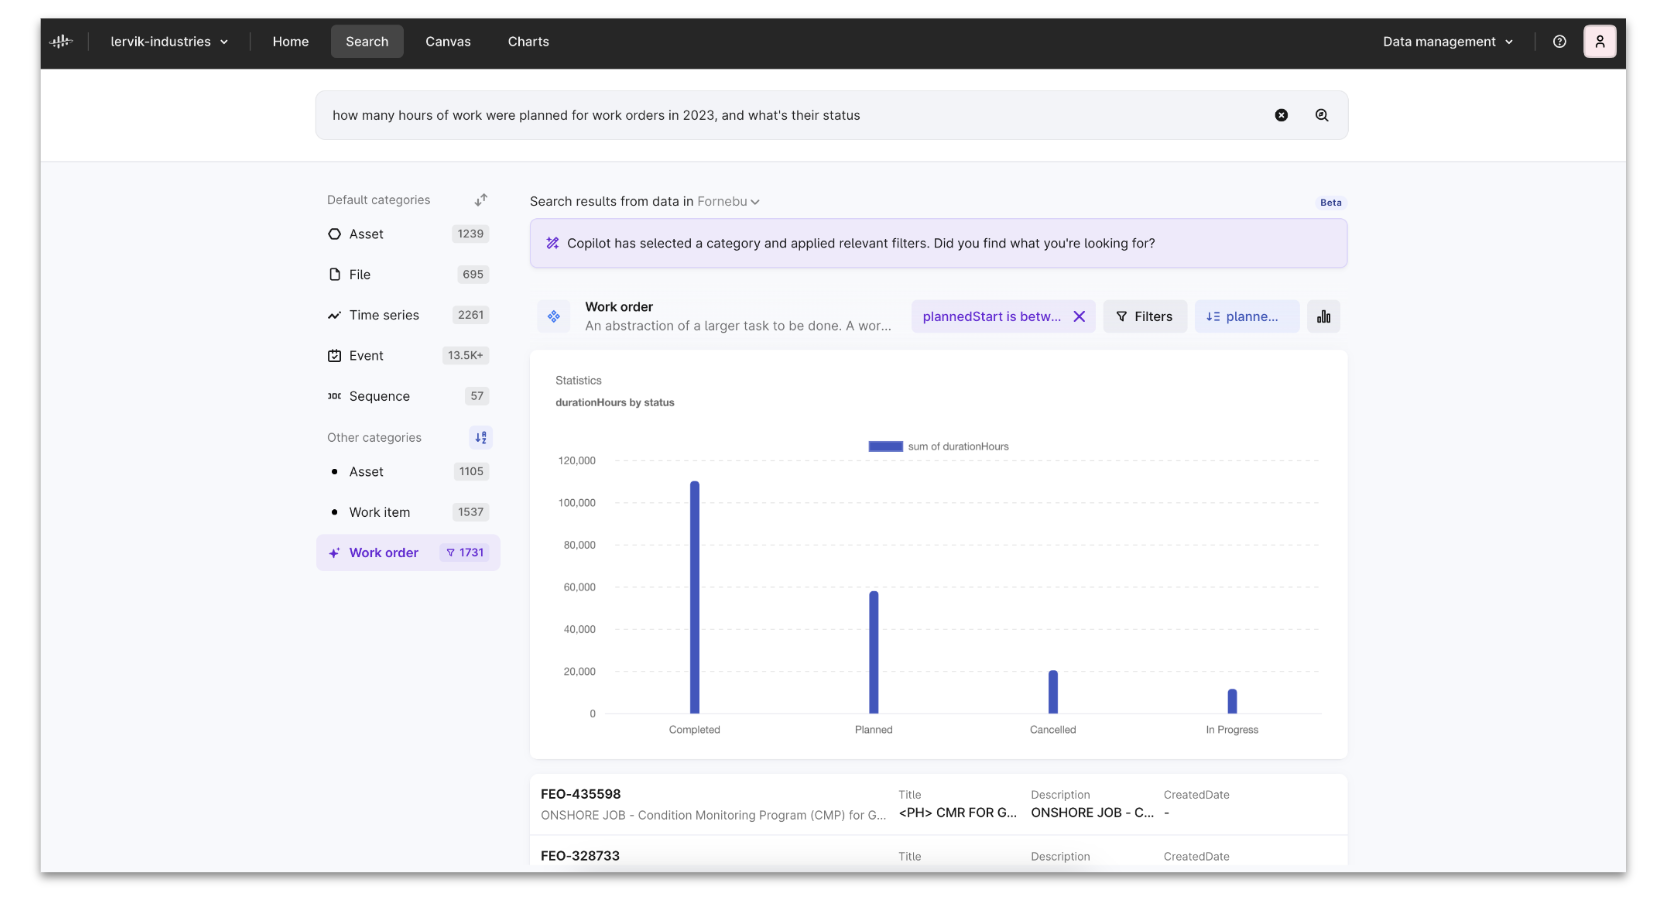
- Our AI Copilot has been further integrated into the search functionality, streamlining the process of identifying categories and creating filters through conversational language. When you know chose to use the Copilot, you will the results appearing in the same interface as when you perform regular search. Additionally, the Copilot is equipped to autogenerate visualizations of statistics, further enriching your data exploration experience. You still trigger the Copilot the same way as before, choosing “Ask Copilot..”.
- Some smaller bug fixes include increasing the portion of text we show (like for descriptions), and showing the label name instead of the label ID (thank you for reporting this!)
Industrial Canvas
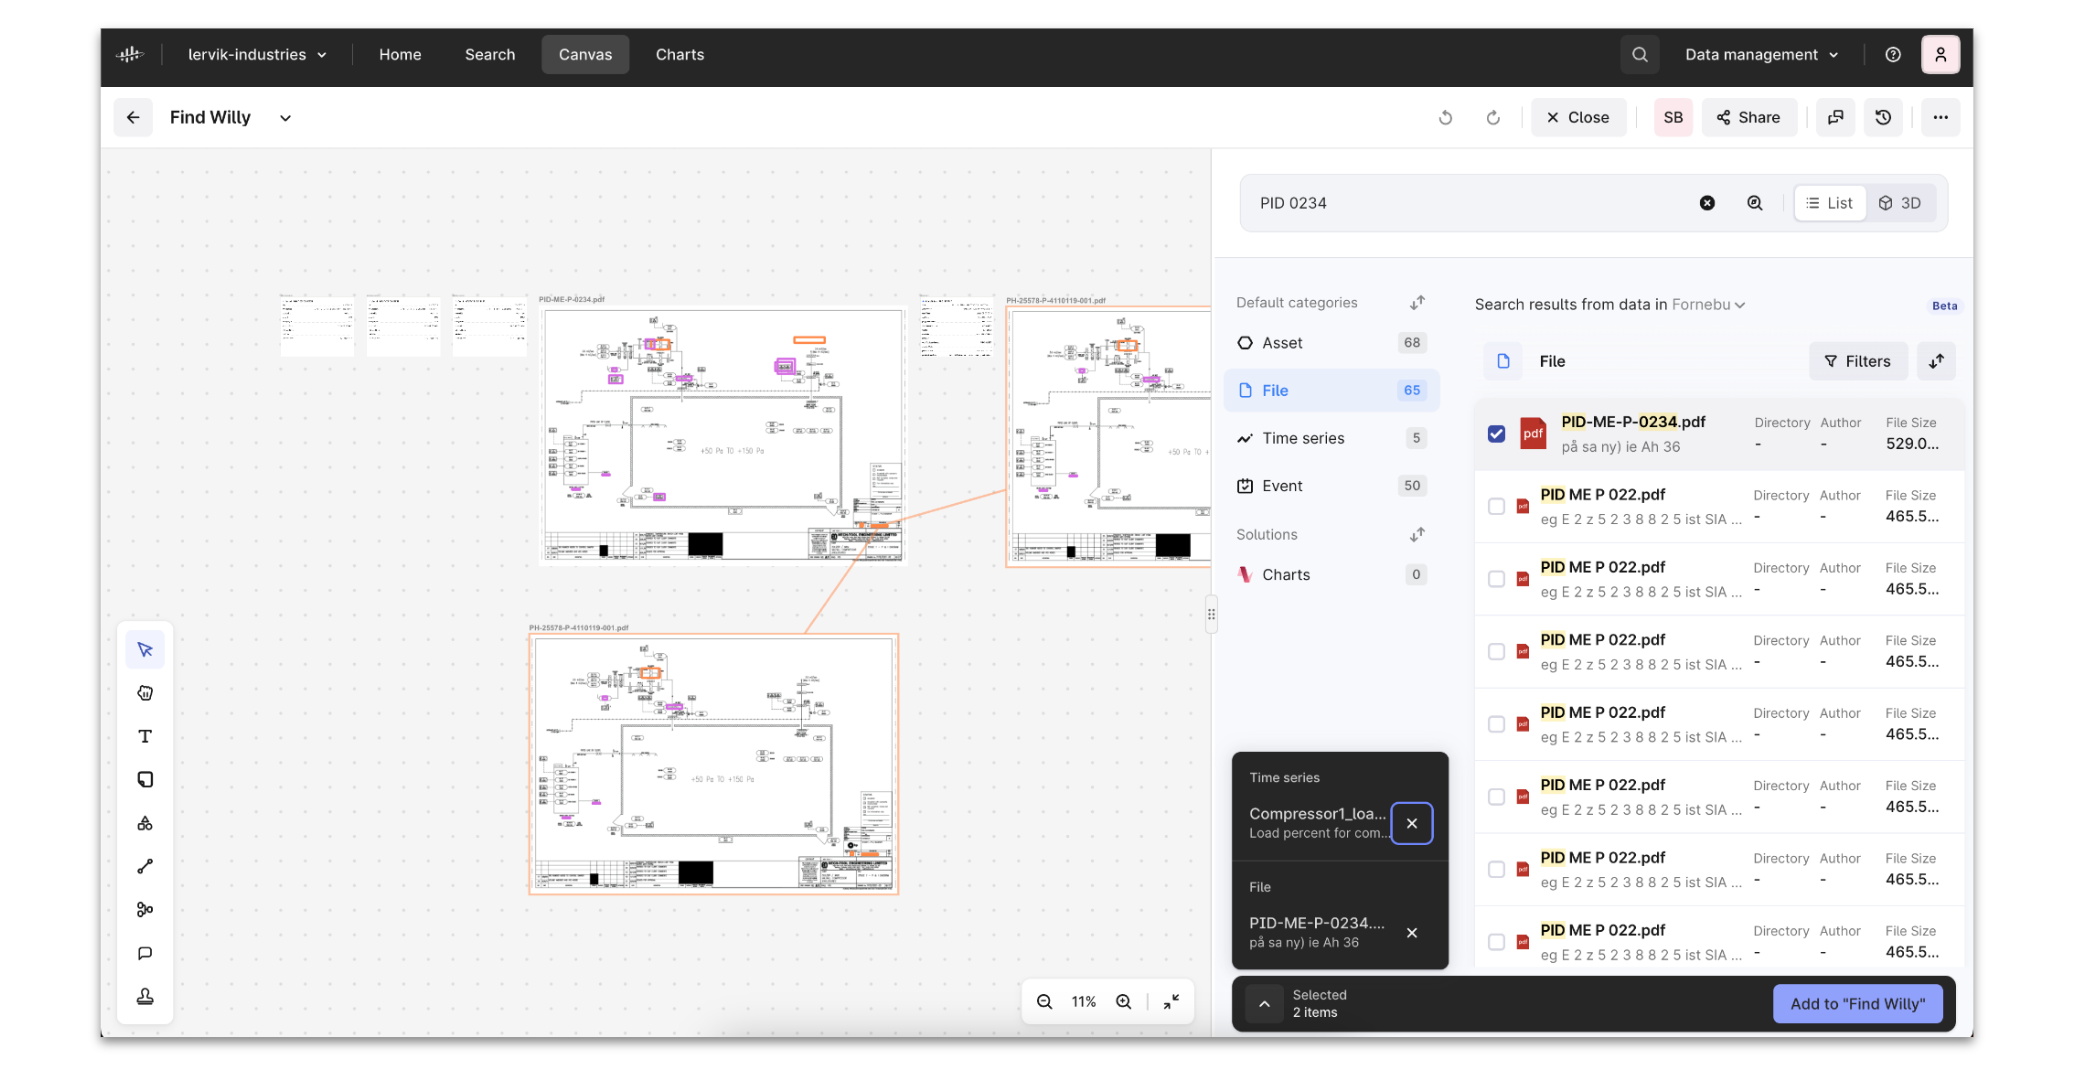
Today we have released an improvement to the experience for finding and adding data to a canvas, by unifying the experience with the Industrial data search. When clicking “Add data” you’ll now recognize the experience from Industrial data search, which gives a more visual way of browsing your data, before adding it to the canvas.
Data Explorer
There are two main improvements released today, both a result of feedback received from you here on Hub.
-
To ease and speed up data exploration, we are now preserving the applied filter(s) and search query while you browse in the details mode (they are reset when you exit the details mode).
When you apply filter(s) and/or Search query in details mode, these are preserved while you are exploring data -
We have made some adjustments to filtering logic in the common filters. In the Metadata filter, you’ll find that there are several keys, each typically having several values each. If you select several values for the same key, these are treated with the OR operation, while between keys we now apply the AND operation. Examples:
-
In the Metadata filter, you select the key “network level”, and two values. This selection is treated as: network level = production_subsystem OR production_system.
-
If you select another key in addition, this selection is treated with the AND operation: network level = production_subsystem OR production_system AND product_type = Gross.
-
Combining the Metadata filter with other common or resource-specific filters is treated with the AND operation.
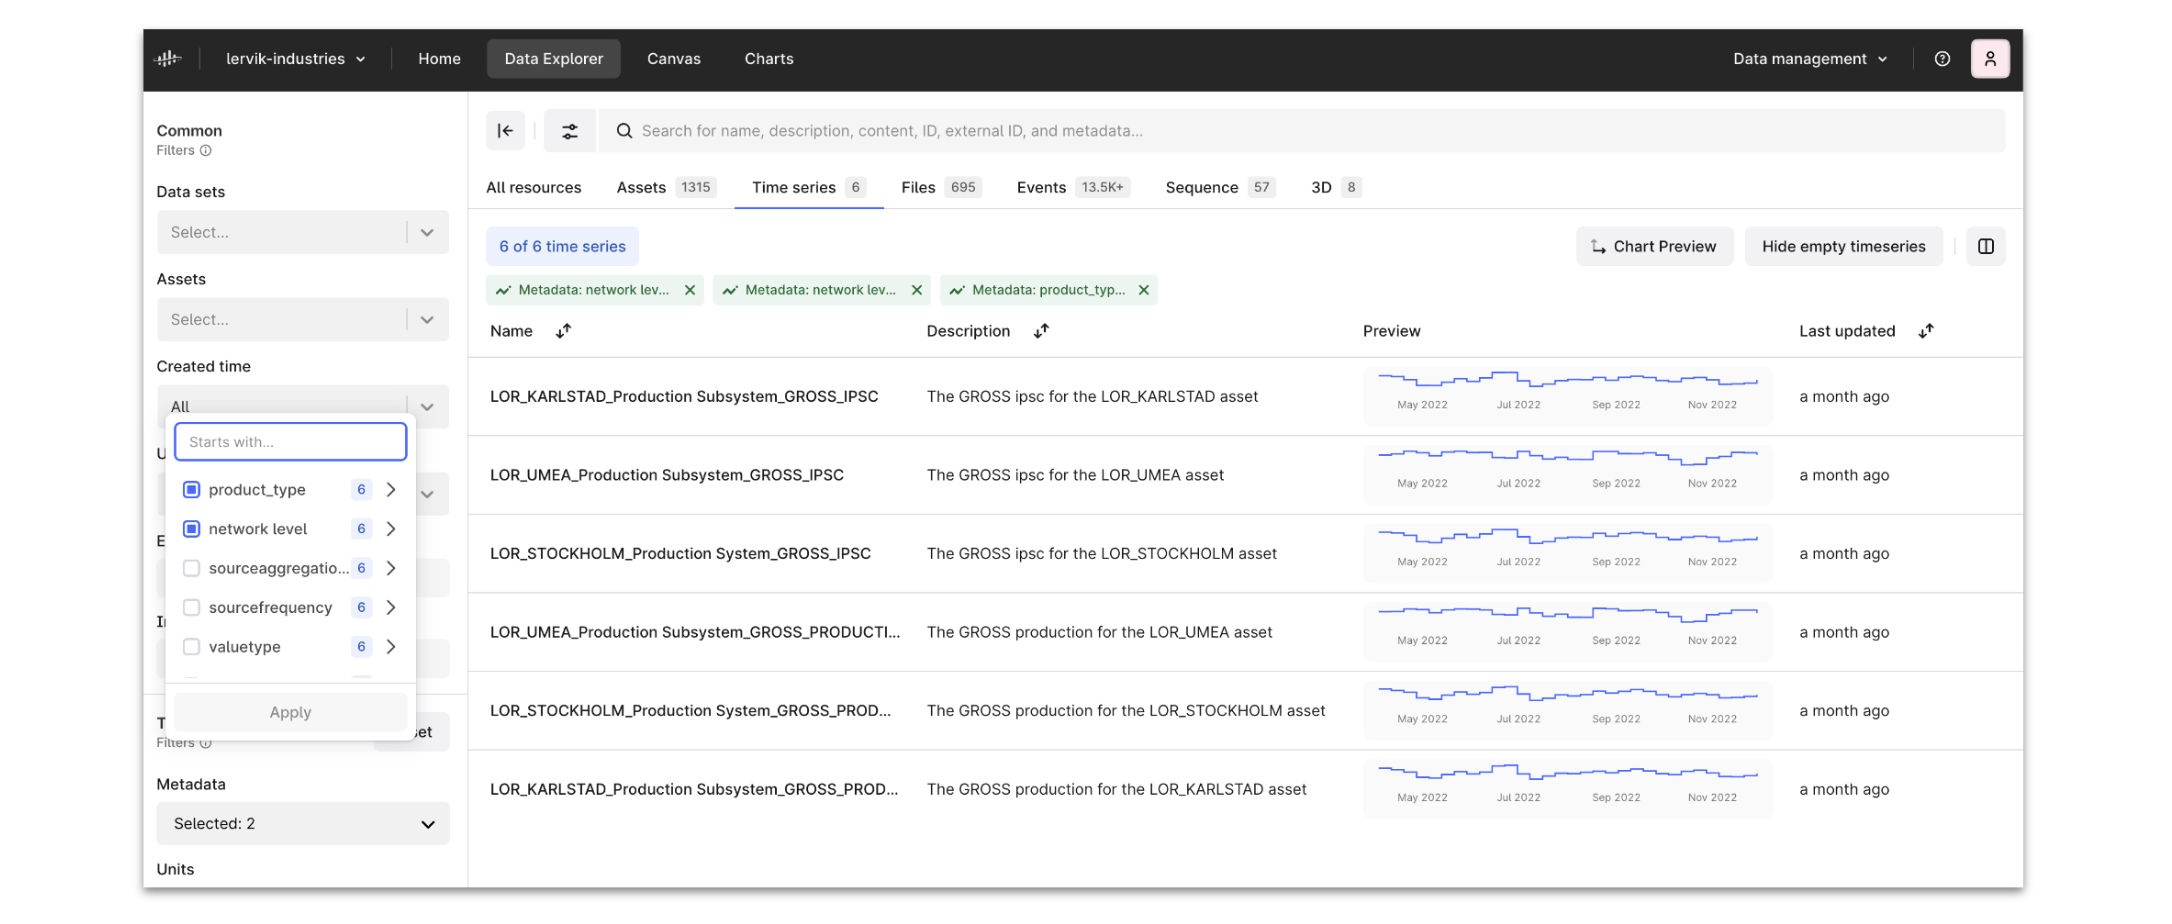
Here we have applied the filters: network level = production_subsystem OR production_system AND product_type = Gross -
Let us know if you have questions or feedback!
Best,
Sofie Berge, on behalf of Cognite Product Management