Join the conversations to shape a safer, more efficient, and sustainable industrial future!
Recently active
OpenID Connect is now available on Open Industrial Data (OID). When you sign up to Cognite Hub, you get an account and can access both the publicdatacdm and publicdata projects.Whether you are new to OID or have been using API keys to access the data in this project, here’s all you need to get started with OIDC. Connection DetailsThe credentials for each project are listed below. Please use the details corresponding to the project you wish to access. For the publicdatacdm Project Details for Postman and Python SDK: Tenant ID: 48d5043c-cf70-4c49-881c-c638f5796997 Client ID: 1b90ede3-271e-401b-81a0-a4d52bea3273 project: publicdatacdm CDF_CLUSTER: api App name: OID-Api Note: This app registration is configured with replyURLs for Postman and to run Python SDK apps locally with http/https.Details for JavaScript Applications: Tenant ID: 48d5043c-cf70-4c49-881c-c638f5796997 Client ID: dea6bb8d-0f48-4bf0-a469-176fc19edc14 project: publicdatacdm CDF_CLUSTER: api App name: OID-js
Hi, Stig, your guide to Open Industrial Data (OID) here 👋In this article, I will introduce you to the reference data set of a industrial process system that the Open Industrial Data project contains. Analogous to what the Iris, Titanic, and gap-minder data sets are to learning data science tools, the OID project will be your entry ticket to working with industrial data. Here is a short technical description of the system on Valhall that is shared on the Open Industrial Data project. System descriptionThe data set represents the first of four stages of treatment of natural gas on the Valhall PH (Production Hotel) platform. The purpose of the gas train is to dry and compress the gas to meet the required export pressure and specification, with a total capacity of 4,06 [MSm3/d] (143 [MMscf/d]).The first stage compressor (23-KA-9101) is an electrically-driven, fixed-speed centrifugal compressor that receives gas from the separators at approximately 3 [barg] pressure. Before reaching the co
In Flows (Search and Charts), a Data Modeling time series shows up under the Default categories (Classic data model time series) by default. When selected in Search it appears with incomplete metadata (including an empty External ID) and cannot be added to a chart (“You can only add time series with external IDs to a chart”), even though the underlying time series does have an external ID.The same time series can also be found under Other categories, where it works as expected: the External ID is shown and the time series can be plotted.The confusing part is that users are presented with the non-working version by default, and there is no obvious indication that they should instead select the time series from another category. Since both entries appear to represent the same time series, I would consider this a UI bug or an inconsistency between how Classic and SDM time series are surfaced in Search & Charts.
Hello Team,Although i have checked the documentation. I would be interested to understand if there is any discussion to generate charts programattically. this would help us Automate ESP surveillance for wells in one go.the idea is that once a well comes online it would automatically generate a ESP chart.
Hello everyone, I am in the transformation part in the Cognite Fusion Data Fundamentals Part 2 - Hands-on. I ran a transmation as asked but it doesn´´t appear in the filter
Add functionality to visualize mathematical formulas rather than the raw LaTeX formatting which Atlas AI currently outputs. If you take a look at the screenshot I think it’s clear that is not a very friendly format to show to our end users Example of preferred output format: Example prompt for replication:Hvordan regner jeg ut volum til 100% fylte endekapsler til en horisontal sylindrisk separator. må anta en endebunnfaktor k, hva betyr denne?Example of how the formulas should be visualized (the visualization of LaTeX, not the raw format)Markus PettersenAker BP - Data Platform Architect
This feature request is to add the ability for Charts to send notification alerts via mobile texts. Often times, manufacturing leadership would like to be alerted off-hours for major operational issues. Text messages have proven to be an excellent means of alerting key resources outside of normal working hours.
Whether CDF natively supports semantic/ontology-based relationship modelling (named, typed relationships like contains, hasTimeSeries, performedOn with direction/cardinality/metadata), and whether Atlas AI and other consumers can traverse that semantic meaning rather than just node-to-node links.
Team,We are having an issue where a customer can login from certain geo locations but not others.Where access is denied, we get a 403 response. The customer’s IT team is involved, and they can’t seem to solve this issue.Has anyone experienced this issue?
When creating calculations in CHARTS it would be VERY useful to have logic functions (AND, OR, NOT, XOR) which allow multiple (>6 for AND and OR) boolean inputs (TRUE/FALSE) and a single output.This would be really useful for tracking events which may be dependent on multiple conditions being active (or not active).
Hi everyone,The Cognite Python SDK now supports State time series, from cognite-sdk 8.20.0.State time series track the discrete states of equipment, such as OPEN/CLOSED or RUNNING/STANDBY/ERROR. Each time series links to a state set that defines the valid states. CDF validates datapoints against that set and offers aggregates built for states: time spent in each state, number of transitions into each state, and count per state. If State time series are new to you, start here: https://docs.cognite.com/dev/concepts/resource_types/state_timeseriesGetting startedpip install --upgrade cognite-sdk # or uv add cognite-sdkfrom datetime import datetime, timezone from cognite.client import CogniteClient from cognite.client.data_classes import ( StateDatapointsInsert, StateDatapointWrite,)from cognite.client.data_classes.data_modeling import NodeId, StateSetEntry from cognite.client.data_classes.data_modeling.cdm.v1 import ( CogniteStateSetApply, CogniteTimeSeriesApply, ) c
How can we get access to work hands-on with the learning path athttps://cognite-learn.fusion.cognite.com/cdf-fundamentals/data-models?cluster=api.cognitedata.com&workspace=data-management?If not, how can we practice hands-on with Cognite Learn?
Manual rotation of credentials is often time-consuming and leads to outages when done incorrectly. To make it simpler to automate, could Cognite add API endpoints dedicated to updating credentials?This is especially relevant for Cognite functions, which currently require sometimes lengthy redeployments to update secrets. When I ask GitHub Copilot about which API endpoints Cognite Toolkit invokes to update secrets and credentials used by a Cognite function, implementing this myself on top of the existing API seems very brittle.I think automating the rotation of credentials will be much simpler if it can be decoupled from other deployment processes.
When i login to Congite-learn organization, i have access only project cdf-fundamentals when i switch to another project. I don’t access. Please advise and help how to get it.
We observed that search behavior differs between Asset Centric and Data Model.Asset Centric search provides more flexible matching and returns results based on relevance, allowing users to find assets using partial text. The Asset Centric View would performs a Fuzzy Search and returns results that are best match to the search text.However, in Data Model View we are required to input the exact text with correct spacing/hyphenation, prefixes etc. to get the results and does not perform fuzzy search.Users transitioning from Classic to Data Model have found difficult to work with the new search mechanism as they do not always key in the correct names or search queries. While we understand the Search mechanism from Classic cannot be implemented on Data Model we wanted to add a topic to see if we can have the Data Model search to more forgiving and user-friendly through partial matching, typo tolerance, relevance-based ranking or similar mechanisms.
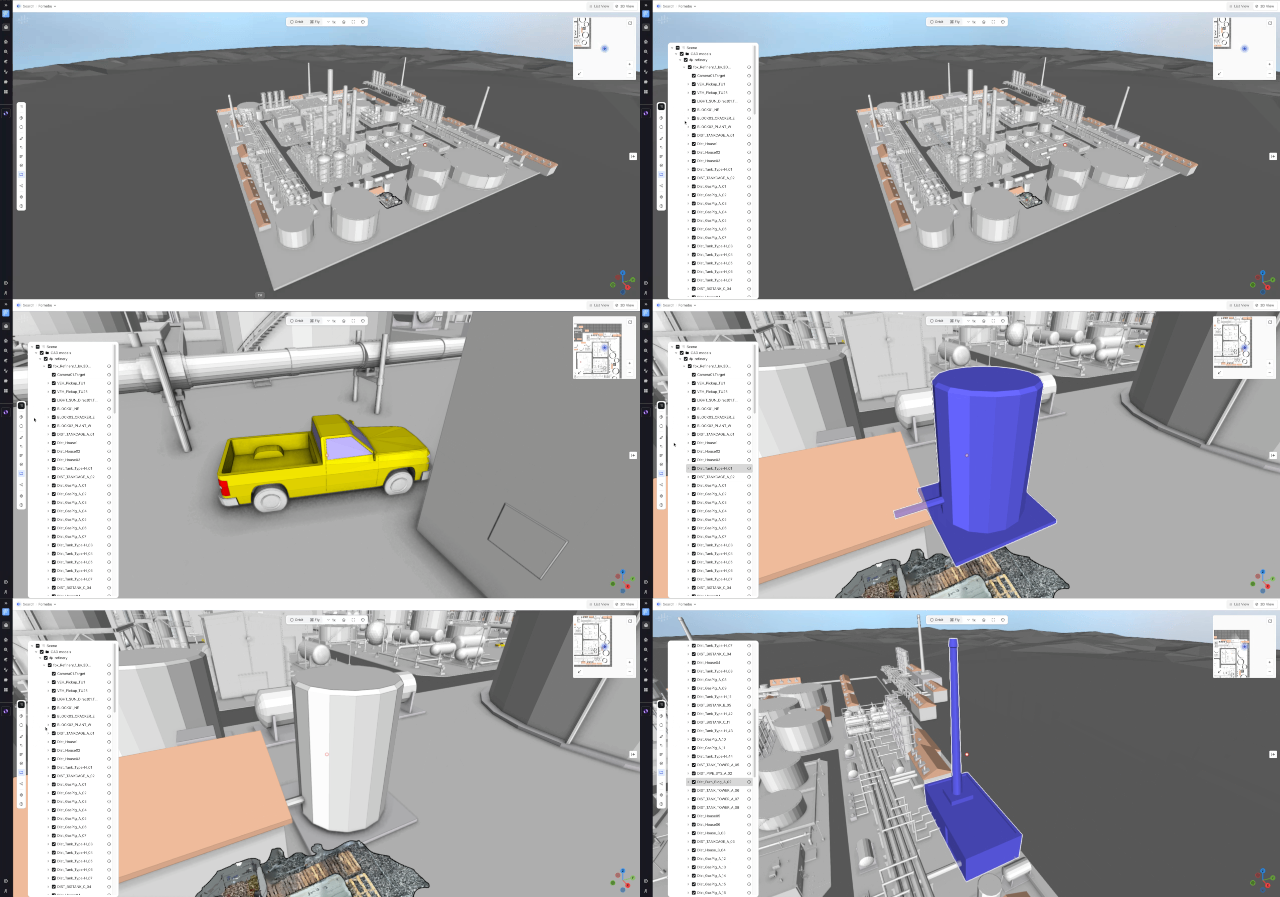
Hi everyone,We’re pleased to share an update to the Unified 3D application in Cognite Data Fusion that makes navigating CAD models faster and more informative.What’s newNew CAD tree display — a structured tree menu on the left side of the screen makes model hierarchy easy to explore at a glance. Node highlight — selecting a node in the tree highlights the corresponding geometry inside the 3D view. Auto-zoom camera — when you pick a node from the tree, the camera automatically zooms to that part for immediate, clear visibility. Node properties via info icon — an info (i) icon at the end of each node name opens a properties panel showing metadata and attributes. The panel opens without changing your current camera view, so you can inspect details while keeping visual context.Why this helpsFaster navigation — jump directly to relevant parts of large models without manual orbiting or searching. Clearer context — highlight + auto-zoom reduces ambiguity about which component you’re inspectin
As we move towards having a data model and location filter we consider as the default for our company we no longer see a use for the system default in most our CDF projects. Is there a way to override the system default so that all new users have one of our custom location filters rather than system default.We are moving away from CDF classic, and we only use the core data model by extension, so the system default causes more confusion at this point than anything else.Rather than “System default”, a “Default” set by ourselves is preferred. Markus PettersenAker BP - Data Platform Architect
Minor UI issue.In Charts, Time series preview often appears messy with overlapping text. Two examples:
Preference to use the term "time series" instead of "trend".
Add SORA attribute from BMS.
Add location codes as static information in the F.LOC view to inhance user experience.
Ability to create conditional tasks in InField. An example is shown below: If a user answers "Yes" to any of the items in the checklist below, new checklists (Category 1, 2, 3) should be generated.Norwegian: Ønsket er å kunne opprette conditional oppgaver i InField. Et eksempel er vist under. Hvis man svarer "Ja" på noen av punktene i sjekklisten under ønsker man å opprette nye sjekklister (Kategori 1, 2, 3)
As an administrator of CDF in Aker BP I have a need to see all apps we have deployed, not necessarily accessing the apps, but knowing they exists. As a minimum this information should be available through the API. This is the information I’ve found in the Cognite Docs, I can do it per app from the app repo. But that requires that I already know it exists and that’s the heart of the issue, I don’t know all the apps that exists. If someone has deployed and published an app without activating it, then I have no way of knowing about it. Hiding non-activated apps from most users is a useful feature, but hiding it from the admins is a security breach. I am aware that tooling for managing this will come, but that does not remove the need for the information to be available through the API. There is still a need to export the information to data/app catalogues for the sake of governance. Markus PettersenAker BP - Data Platform Architect
Hi Community,Has anyone successfully configured the Cognite DB Extractor to connect to Databricks via ODBC using a service principal?I was able to connect to Databricks using a Personal Access Token (PAT), but I am experiencing issues when trying to authenticate with a service principal.Any guidance or examples would be greatly appreciated.Thanks in advance,Andre


 Check the
documentation
Check the
documentation Ask the
Community
Ask the
Community Take a look
at
Academy
Take a look
at
Academy Cognite
Status
Page
Cognite
Status
Page Contact
Cognite Support
Contact
Cognite Support