

 Check the
documentation
 Ask the
Community
 Take a look
at
Academy
 Cognite
Status
Page
 Contact
Cognite Support



Cognite Data Source for Grafana v4.7.0: Full time series and Records support
Hi everyone,
We've released v4.7.0 of the Cognite Data Source for Grafana. You can now visualize every time series type and your Records data directly in Grafana.
Time series: all types, latest features
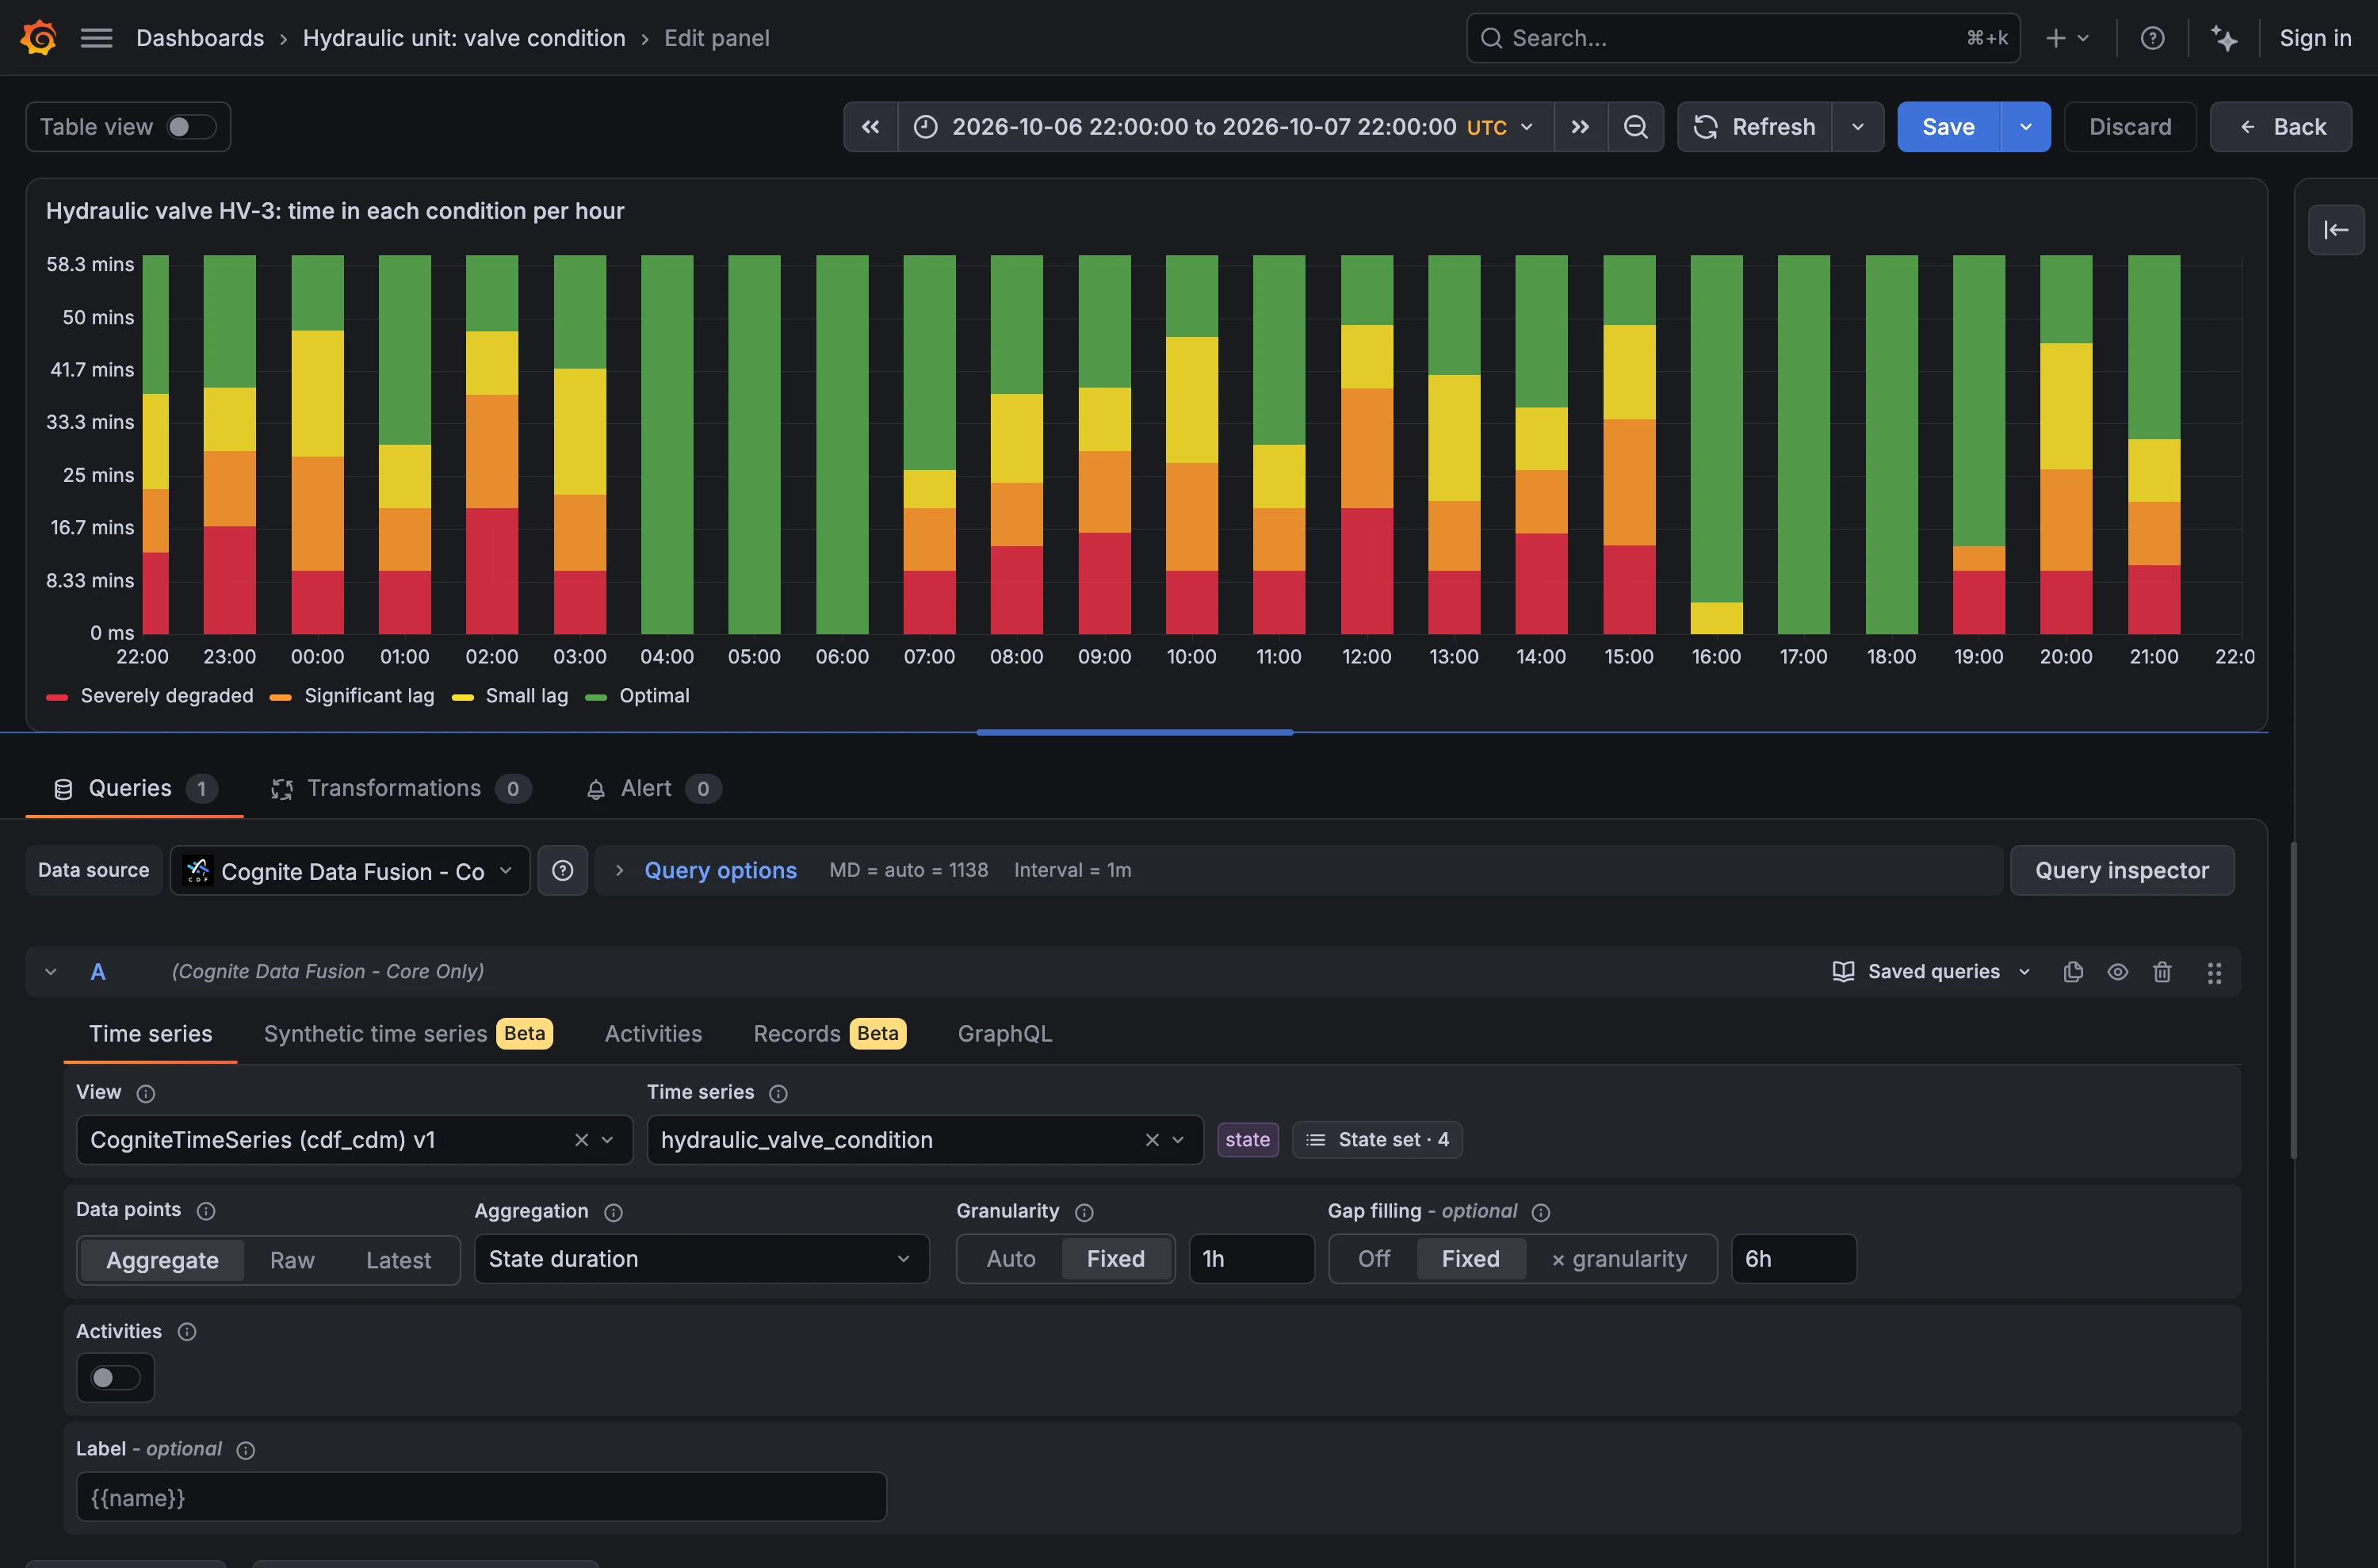
The Time series features now supports numeric, string and state time series. The aggregation options adapt to each type. For state time series, you can see how long equipment spent in each state, how often it changed state, and which state dominated each interval. The tab also supports gap filling and status aggregates.
Records: list and aggregate (Beta)
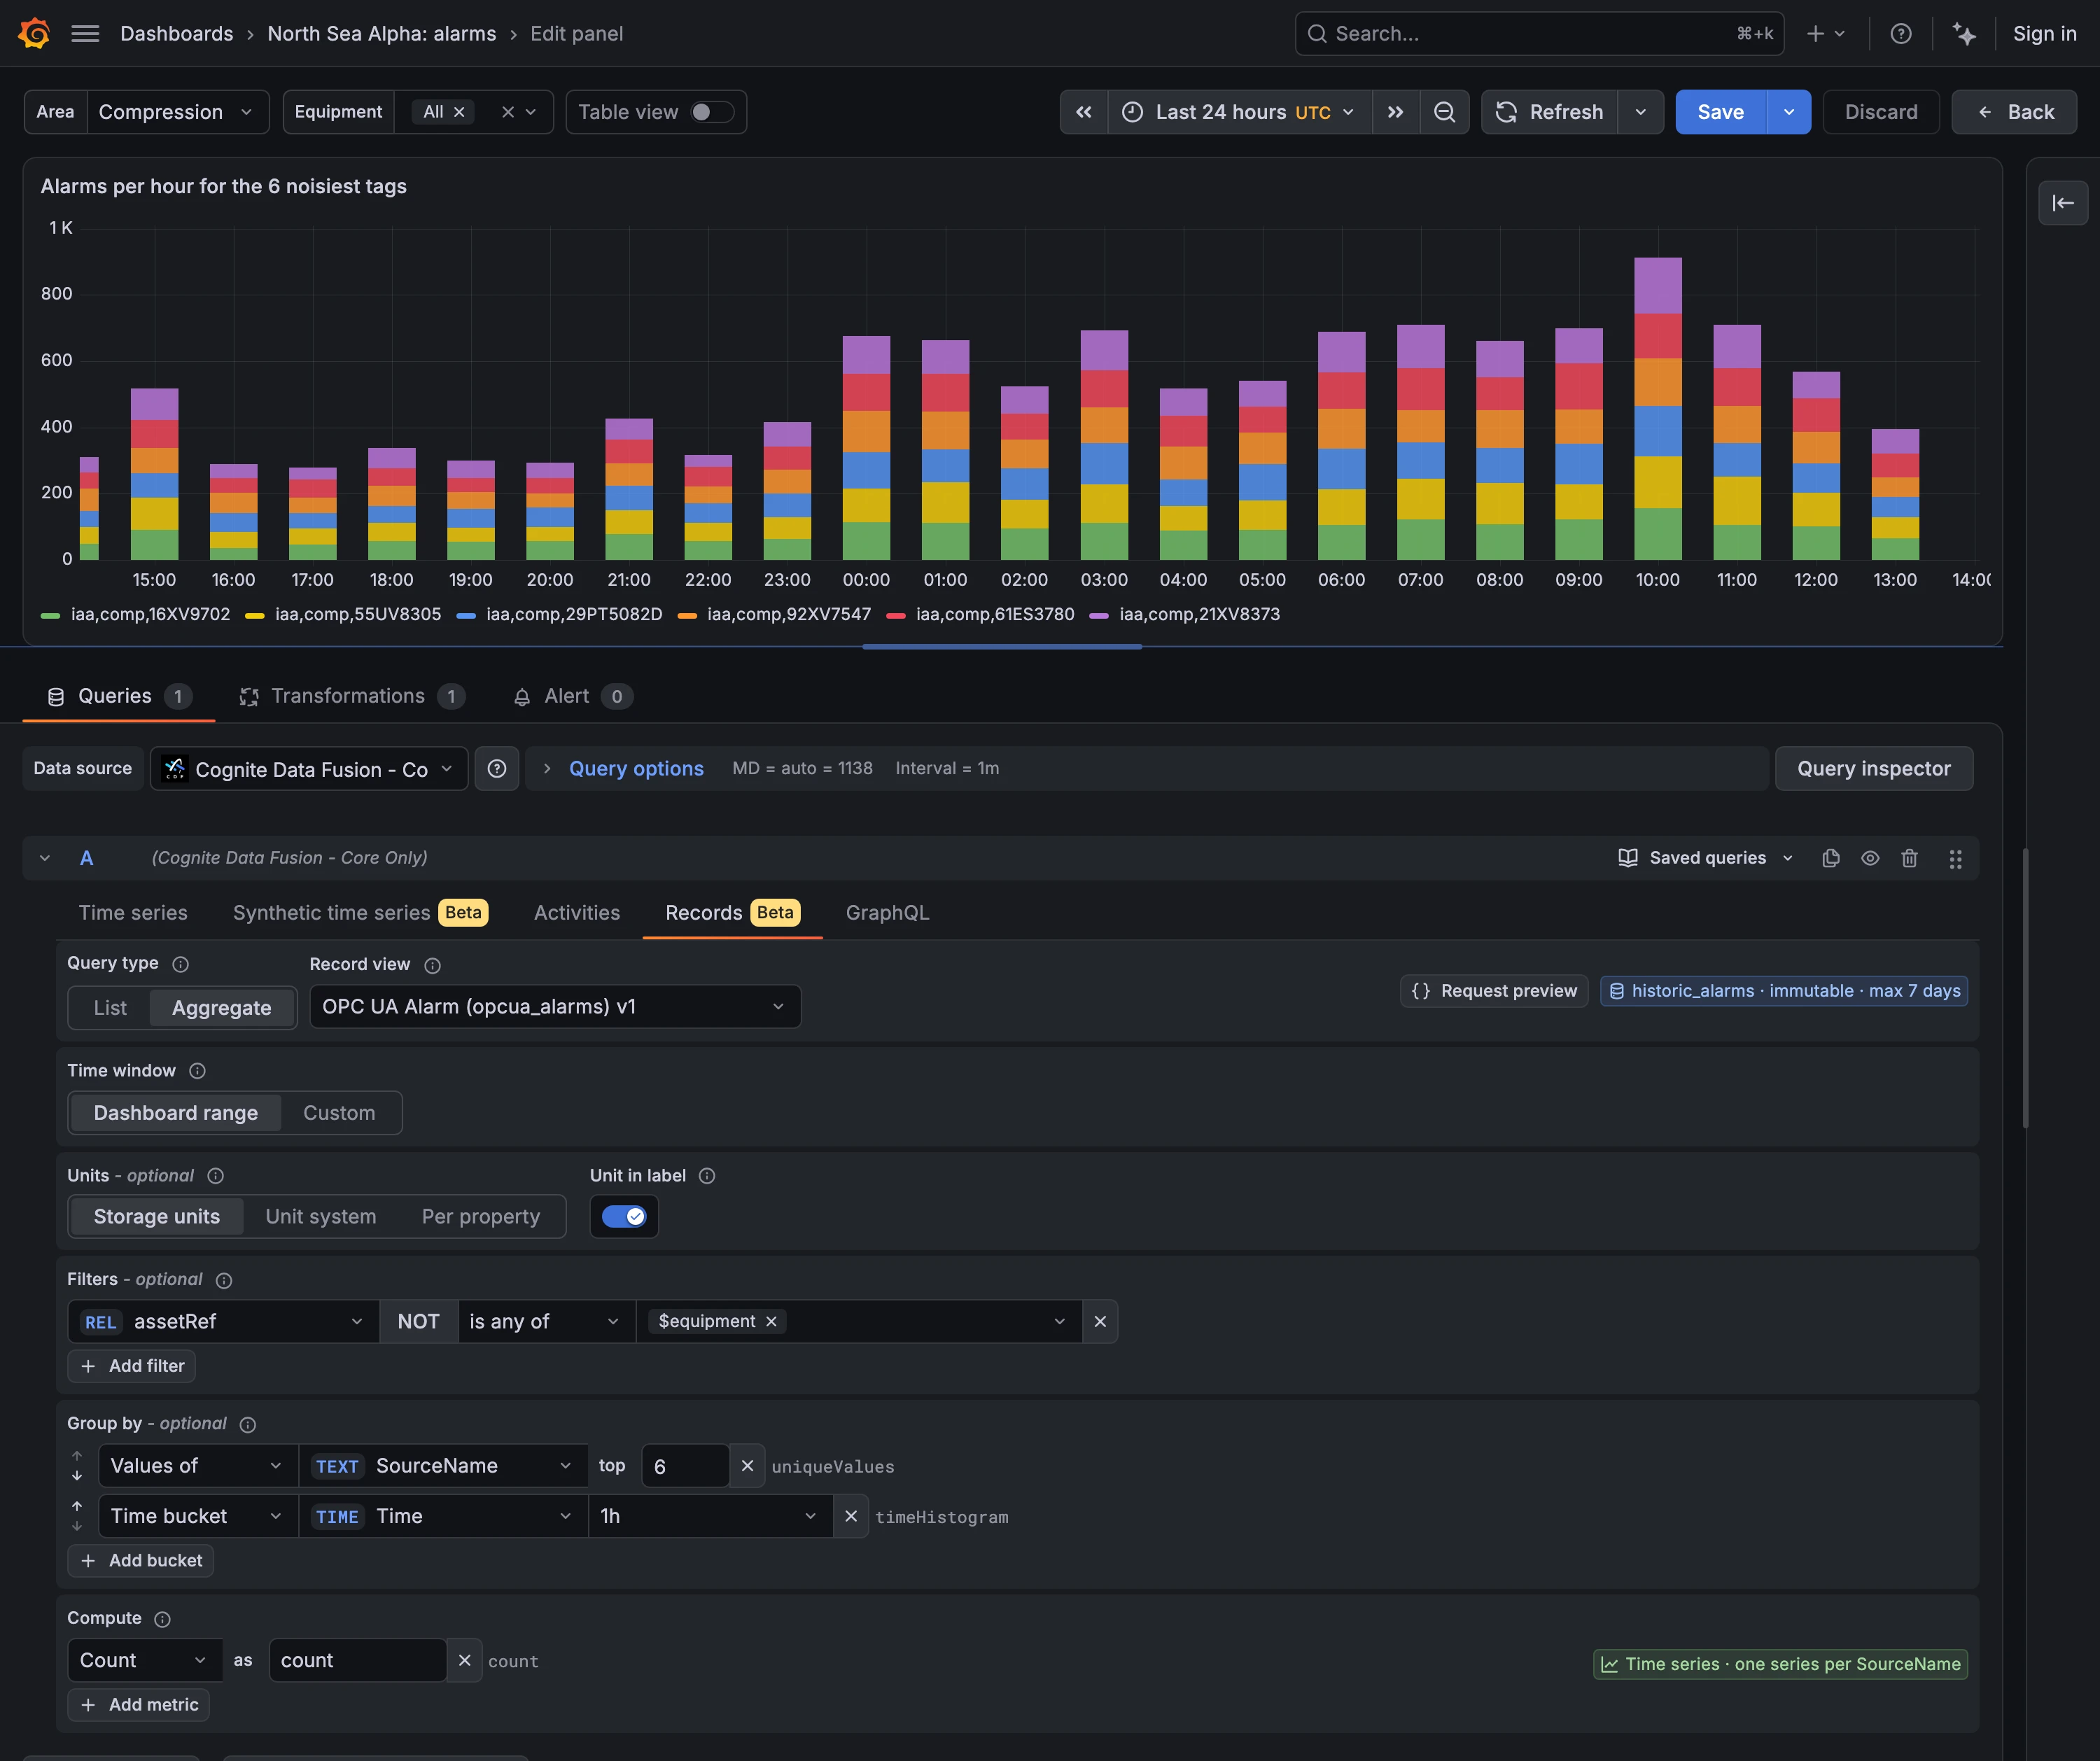
In the Records tab you can list records as a table, or have CDF aggregate them into time series and KPIs, grouped by time buckets and property values. Dashboard variables work in filters. The example below shows alarms per hour for the noisiest tags.
How to get started
Grafana Cloud updates the plugin automatically. On self-hosted Grafana, update the plugin from Administration > Plugins and data > Plugins. The plugin requires Grafana 10.4.7 or later, and there are no breaking changes.
For the full list of changes, including the new Synthetic time series tab (Beta) and deprecation notices for asset-centric features, see:
- Documentation: https://docs.cognite.com/cdf/dashboards/guides/grafana/getting_started
- Changelog: https://grafana.com/grafana/plugins/cognitedata-datasource/changelog/
Records is in Beta, so we'd love to hear how you use it and what's missing. Let us know in the comments.
