

 Check the
documentation
Check the
documentation Ask the
Community
Ask the
Community Take a look
at
Academy
Take a look
at
Academy Cognite
Status
Page
Cognite
Status
Page Contact
Cognite Support
Contact
Cognite Support
Hei Everyone!
We're excited to announce the latest updates to Charts, designed to enhance your data visualization and analysis experience. In this release, we've focused on improving data viewing capabilities, introducing new features for better visual analysis, and enhancing monitoring job setup and validation. These enhancements are aimed at providing users with greater flexibility, control, and confidence in leveraging Charts for their data-driven decisions.
a) Improved Chart Data Viewing and Trust in the data viewed
- Increased the maximum number of raw data points viewable in a chart from 500 to 100,000.
- Aggregate min/max shading is now enabled by default when switching to aggregate data.
This substantial increase in data points allows for a more comprehensive analysis of data trends in RAW mode without the need to switch to aggregated views prematurely. This min / max shading being on by default should ensure that users are better aware of when they are viewing aggregated data. We hope that these changes should help build better trust in Charts and make the data look more similar to what is viewed in PI systems.
b) Slider/Marker Functionality in Charts:
- Users can set and delete multiple sliders/markers to compare values across various points in a time series.
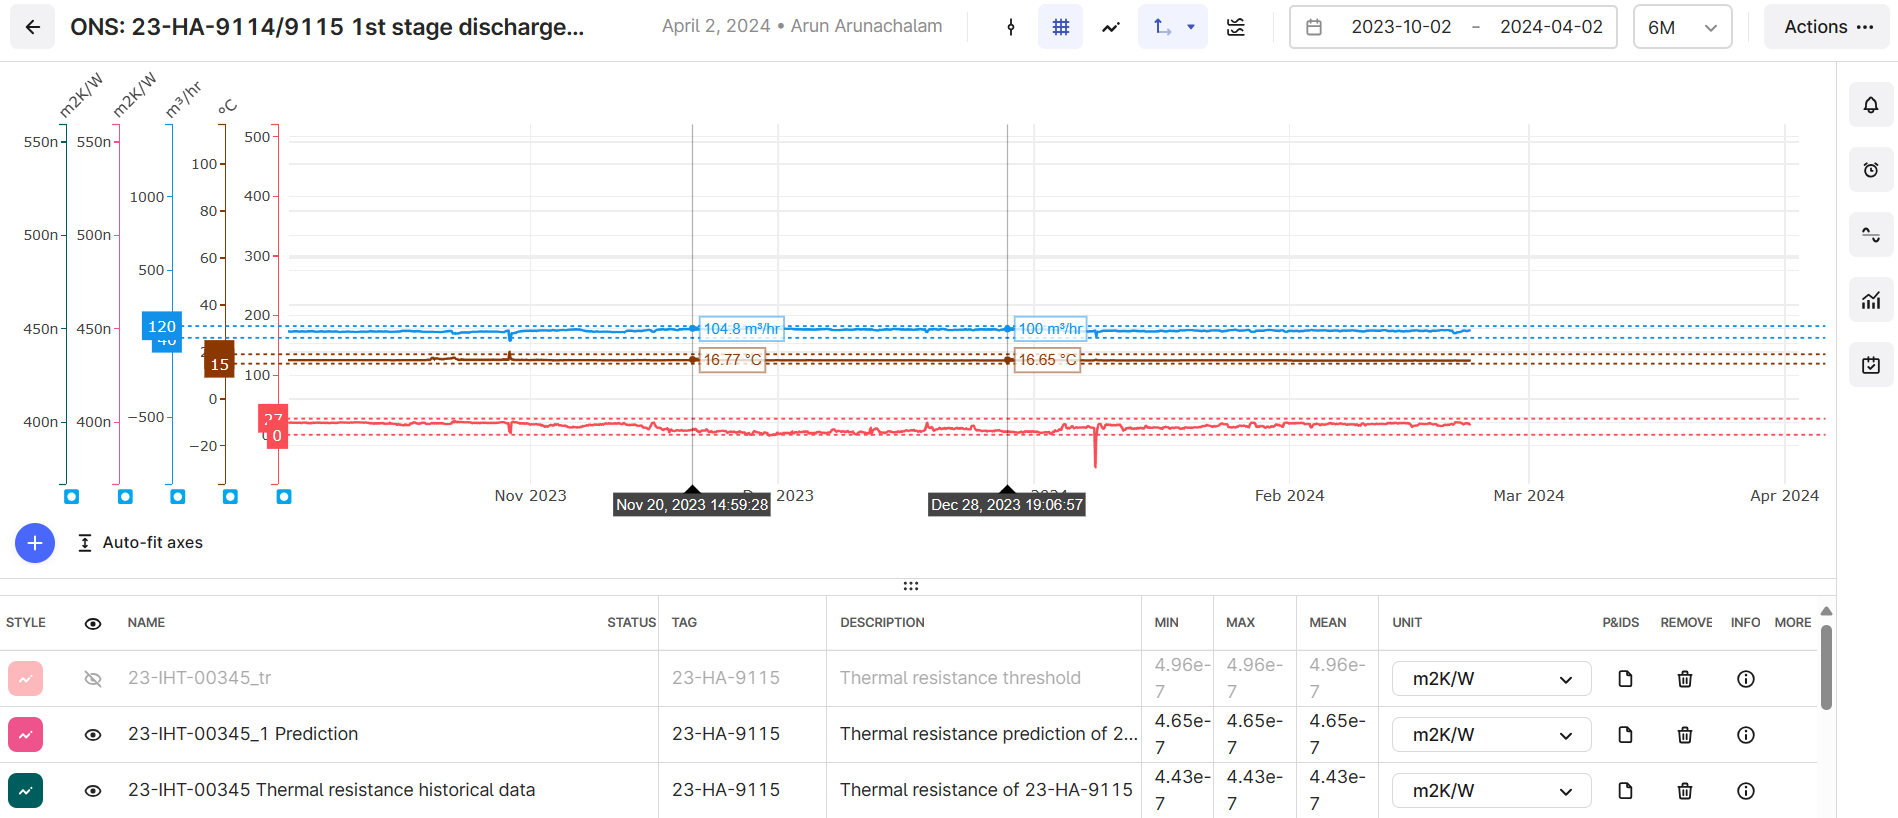
With this new functionality, users gain the ability to freeze values at specific points in time within a given chart. By setting multiple sliders/markers, users can effectively compare data values across different time series, enabling deeper insights into data trends and patterns.
c) Backfilling of Monitoring Jobs
- Receive a count of alerts that would have been triggered within the specified time frame when setting up a monitoring job
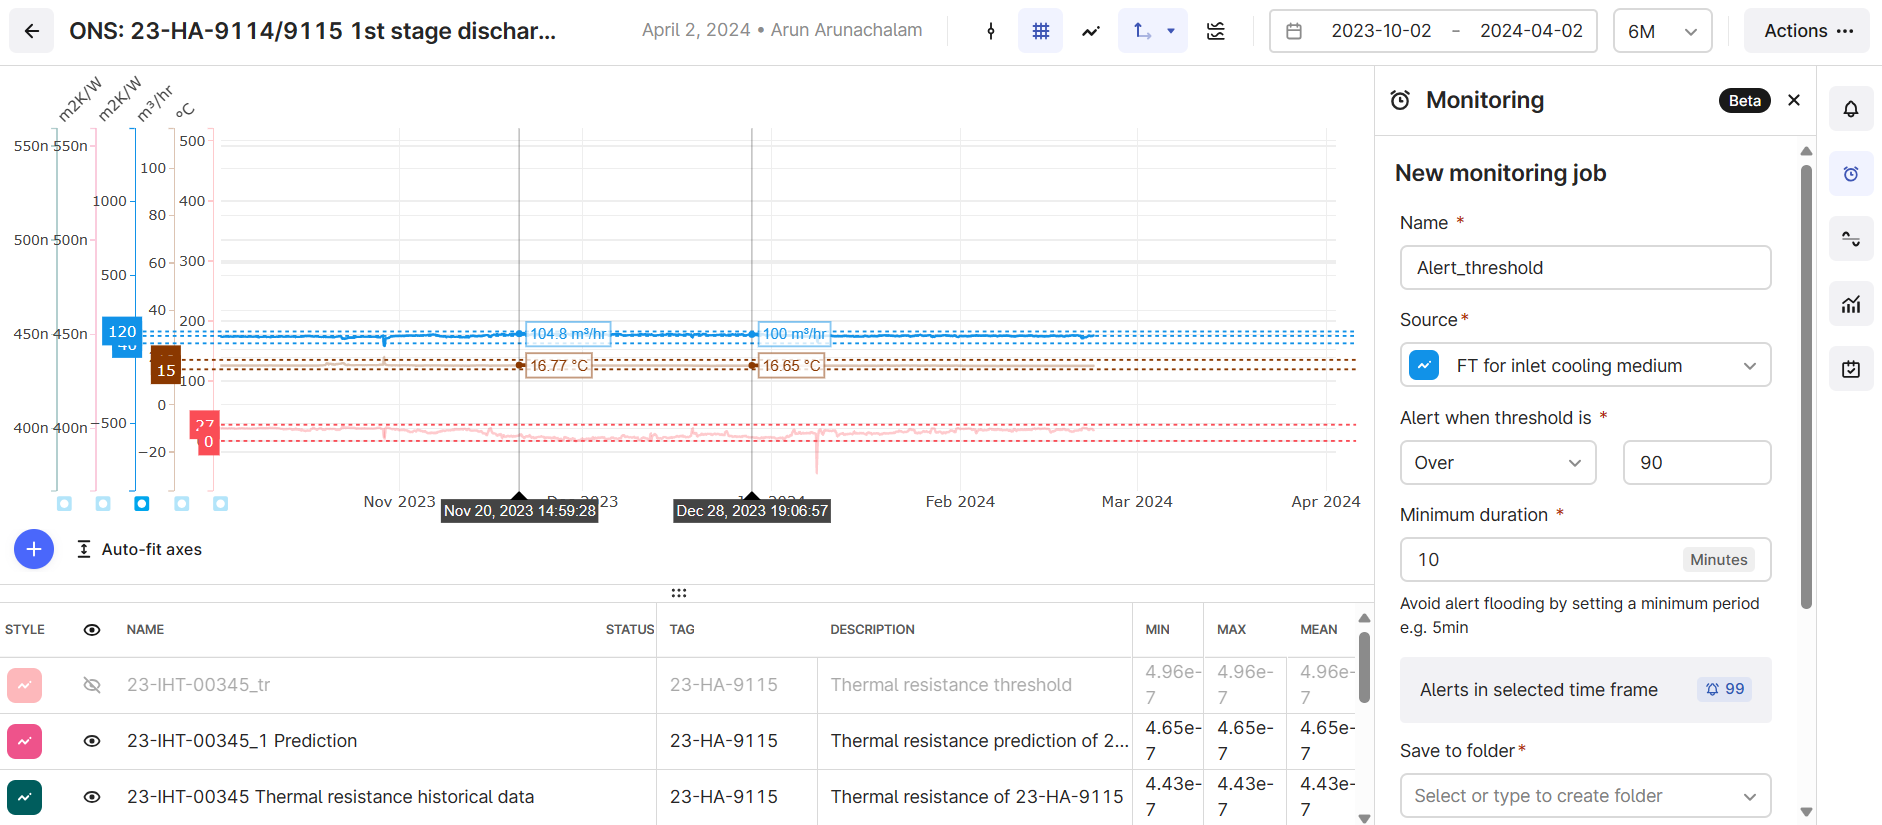
With this latest enhancement, users can now conduct historical runs of monitoring jobs before finalizing their configurations. Upon setting up a monitoring job, users will receive valuable insights into the number of alerts that would have been triggered within the specified time frame based on the configured thresholds. This functionality not only allows users to verify the effectiveness of their threshold values but also helps prevent the potential spamming of alerts by ensuring that thresholds are set at reasonable levels.