Join the conversations to shape a safer, more efficient, and sustainable industrial future!
Recently active
Learning Paths: Build skills step by stepNew learning paths bring related topics together so you can build a solid understanding of key CDF concepts and workflows, progressing from fundamentals to practical implementation.Cognite Flows Foundation Certificate: We’ve recently introduced the Cognite Flows Foundation Certificate learning journey, designed for developers and technical builders working with industrial applications and Cognite Flows.The learning path provides a strong foundation in the Cognite Flows ecosystem, including core concepts, a human-centered approach to application building, engineering architecture, submission processes, and security guidelines — everything needed before getting started with deployment and development in Flows.Who it’s for: Developers, consultants, and solution architectsValue: Build foundational knowledge for industrial application development and Builder Certification preparationDuration: 120 minutesBy completing the learning journey, you will ea
Hi Team,Our observation while storing duplicate entries in Cognite Streams:Mutable Streams - It discards the duplicate entries consistently.Immutable Streams - It sometimes allow exact duplicate entries (externalId and other fields) and sometimes it doesn’t.Even when we checked in the Cognite AI, it says it usually doesn’t allow duplicate entries but in some rare scenarios, it allows.Could you please let us know the behavior. If it allows in rare scenarios, please let us know the exact scenarios.Thanks,Rahul
Maybe this will be solved with the release of Adaptive Experiences, but for now the overview of the published apps is a bit cumbersome to navigate. Here is an example of an app, “Data Quality Dashboard”, that shows up twice, this is the same app but with different versions. The only way to tell from here is the updated timestamp. Would be nice with some kind of indicator showing which is the current version of the app, and maybe some kind of grouping that indicates that it is in fact the same app and not just two apps that happen to have the same name. The apps have a label that shows whether it is a “Flows app” or a “Streamlit app”, but these labels are not searchable, nor is there any functionality that allows for filtering. Would be nice if it was possible to add labels/tags to apps that were searchable allowing us to filter and group apps together. When we have 50+ apps it can be somewhat difficult to navigate.Markus PettersenAker BP - Data Platform Architecht
This idea is related to a previously submitted request:https://hub.cognite.com/product-ideas-492/charts-canvas-streamlit-lock-feature-to-prevent-accidental-deletion-6058?tid=6058&fid=492In most cases, charts with scheduled calculations are highly important. However, currently there is no clear way to distinguish them from regular charts in the list view, which creates a risk of accidental deletion.If a scheduled chart is accidentally deleted, the schedule itself may continue to run, but users would no longer be able to review or verify the calculation logic.To prevent this, it would be helpful to have:A clear visual indicator showing that a chart has a schedule configured, so it can be identified at a glanceA warning message when attempting to delete such a chartAdditionally, it would be even more useful if there were a filter option to display only charts with schedules.
When scheduling calculations created in Charts, the calculated time series is currently written starting from the time the schedule is configured. However, there are many cases where we would like to apply these calculation results to historical data as well.For example, it would be helpful if users could specify a start point in the past using options such as:・“6 months ago,” “1 year ago,” or “3 years ago” from the current date・A specific date and timeWould it be possible to add an option that allows users to apply calculation results starting from a user-defined point in the past?
Two needs:- I want to monitor time series in charts for windows longer than 60 minutes. Current limit is 60 minutes and should be longer.- I want to subscribe common emails to monitored time series (for example <asset-specific.process-engineers>@akerbp.com). Current limitation is that only individuals can subscribe to monitored time series. This is an issue for roles on rotations.What impact would a change have? Time savings Fewer errors / less manual work Better decision-making foundation Better data qualityRequested by: Sindre Fjermedal
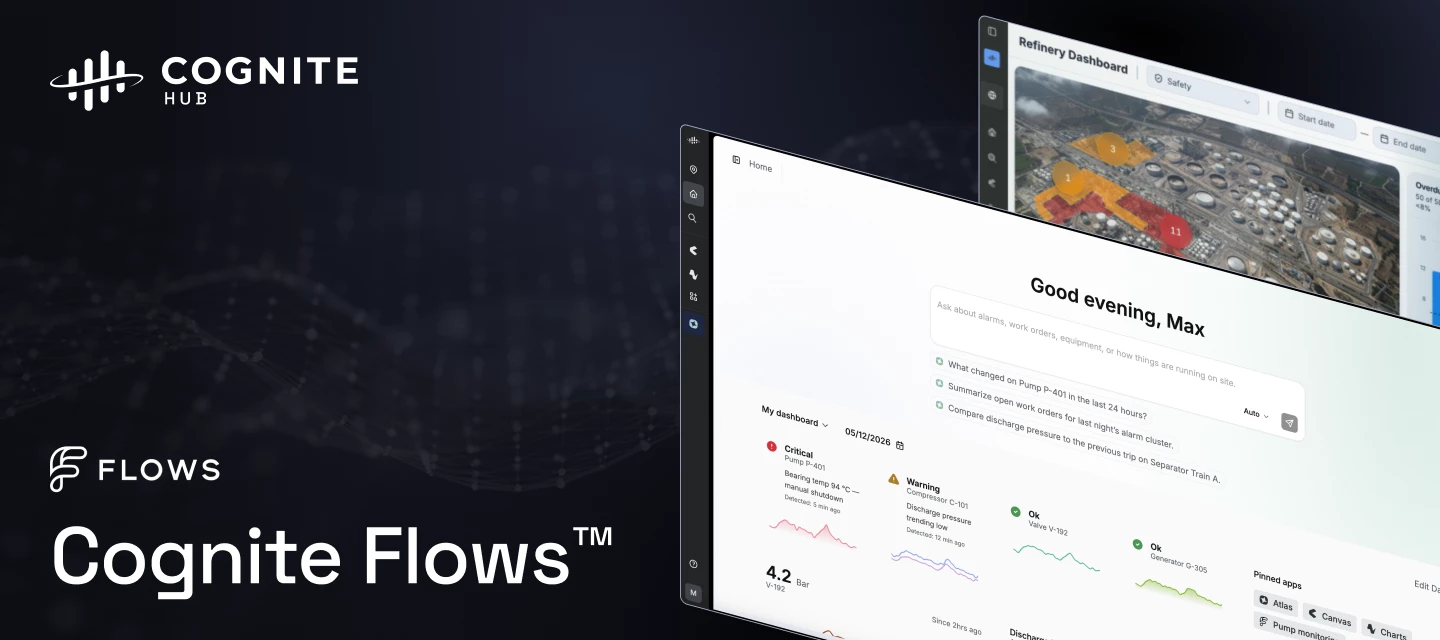
To our 17,000+ strong community: When I joined Cognite almost 6 years ago, the goal was to build a global home for our customers, partners, and Cogniters. Watching this group grow highlights the real "why" behind what we do. You are the operators and frontline teams who keep society running.But true industrial transformation isn't just about keeping the wheels turning. It's about ensuring you have the peace of mind to truly disconnect, knowing everything is running safely in the background.Today, we are thrilled to announce Cognite Flows™.You already trust Cognite Data Fusion with your data. Cognite Flows takes that foundation and sits directly inside your real operational workflows. We know that when something breaks, it impacts your decisions and processes directly. That is why the launch of Cognite Flows isn't just about new capabilities - it is backed by a rigorous framework designed to consistently produce high-quality outcomes across our entire ecosystem.Here is what you can look
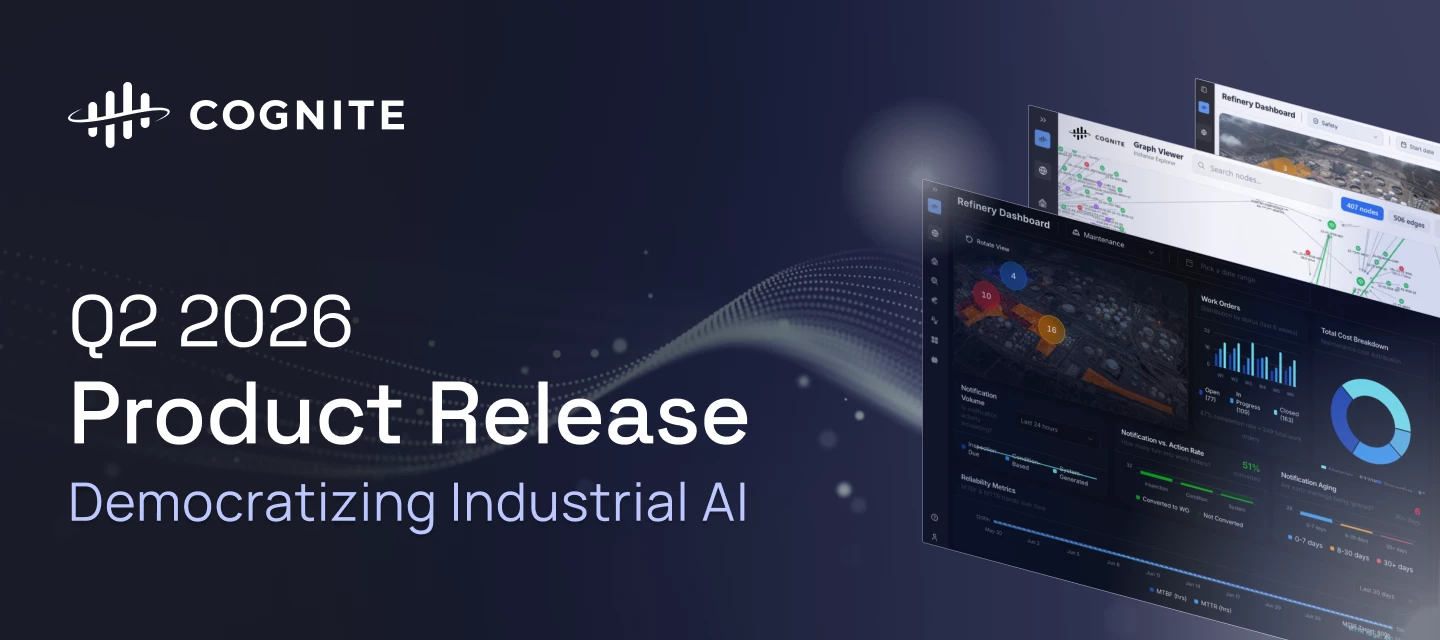
The Q2 2026 release accelerates the democratization of Industrial AI, empowering teams with production-grade custom app infrastructure and declarative data workflows. We have significantly increased industrial workforce capacity through precision search migration, zero-code CSV exports, and immersive 360° spatial walkthroughs. To rapidly scale use cases across the enterprise, builders can now leverage lifecycle-managed Atlas AI Skills and native agent execution to deliver a unified, intelligent experience across all Cognite Data Fusion (CDF) applications. Review the core release highlights below to discover how these advancements are accelerating time to value by making Industrial AI more robust, scalable, and accessible for the entire industrial workforce.Cognite Flows - Native and Custom apps Cognite Flows - Custom Apps Cognite Flows - Adaptive Experiences Cognite Flows - Application Certification Cognite Flows - New Developer Experience Industrial Canvas - Symbol Library Update
The documentation link takes me to a 404 page:
The color in the status bar doesn’t match the legend:
Hello :) Use caseAs an AI evaluation engineer, I want graph relations returned by the agent to be resolved into the underlying equipment and time series instance IDs in the structured JSON output, so that recall metrics reflect the instances the agent actually identified, not only the relation objects it retrieved. BackgroundI am evaluating agents that retrieve process data from an industrial knowledge graph in Cognite Data Fusion. I use a simple Python-based recall evaluator that compares expected equipment/time series IDs against IDs returned in the agent’s structured JSON output. Current behaviorThe agent may identify the correct equipment or time series in the natural-language response, but the structured JSON sometimes only contains the relation objects it used to infer them. This is mostly invisible to the end user, because the answer can still be correct. The issue is automated evaluation: correct retrievals may be undercounted because the expected equipment/time series IDs are
It would be great if they could compare InField data with PI Data directly within InField checklist. The attached file shows InField values, but they would like to be able to display them for comparison with instrument readings (PI Data).
Currently, when a Canvas or Chart is created, the creator is automatically assigned as the “Owner.” We would like to request the implementation of a feature that allows ownership to be transferred to another user.BackgroundIn our operations department, Canvas and Charts are used for long-term operational monitoring. However, the primary person in charge changes relatively frequently. Therefore, we need a mechanism that allows ownership to be transferred smoothly to the next responsible person.From a long-term operational perspective, having the original creator remain as the owner even after role changes or internal transfers raises concerns regarding internal security and governance.For these reasons, we would greatly appreciate it if an official ownership transfer function could be implemented.Additionally, @Shun Takase-san from Nippon Shokubai commented that since Canvas and Charts can be searched by the creator’s name, having the current responsible person listed as the creator si
Help! I am currently facing an issue where the dataset data type is set as string = true, whereas it should be false (numeric). As a result, the chart is not displaying any data due to the field being treated as a string.However, when I download the dataset as a CSV file, the data is present. Could you advise if there is a quick fix on your side to convert the data type from string to numeric?
I am currently facing an issue where the dataset data type is set as string = true, whereas it should be false (numeric). As a result, the chart is not displaying any data due to the field being treated as a string.However, when I download the dataset as a CSV file, the data is present. Could you advise if there is a quick fix on your side to convert the data type from string to numeric?
How to get Early adopted for document parsing, i got 3 environments in the request - https: //cognite. zendesk. com/hc/requests/18058. please can someone make it available for us in those 3 environments ?xom-upstream-devxom-upstream-testxom-upstream
May our 3 projects have access to Document Parser as an Ealier adopter ?i have opened this request - https: //cognite. zendesk. com/hc/requests/18058
Hi,We're using the Cognite DB extractor (version 3.9.2) with a MongoDB database (Azure Cosmos DB via the MongoDB API) and are trying to set up incremental loading.The documentation for mongodb (https://docs.cognite.com/cdf/integration/guides/extraction/configuration/db#databases.mongodb) doesn't mention the use of start_at and incremental_field but after testing them and looking at the debug logs, we can see the extractor sends the {start_at} placeholder literally without substituting the state value. My questions are: 1. Is start_at substitution supported at all for MongoDB JSON queries, or is it SQL-only? 2. If incremental loading is not supported for MongoDB, is there a recommended workaround?Thanks.
what are the typical use cases that Cognite AI can solve Integrated Supply Chain challenges?
The “Compare trends” function in the trend view is a great functionality to compare different trends. Today the Y-axis of the graphs does not align when comparing multiple trends. For example in the trend view below, the Y-axis of the purple trend is way higher than the axis for the blue trend line. 45% and 100% is placed at the same position. It is possible to manually zoom in and out on the Y-axis and then align but it would be better if there was a way of aligning Y-axis on a more user friendly way or alternatively that the axis are lined by default :-)
I uploaded a PDF maintenance manual into Cognite CDF using:client.files.upload(...)The document is successfully indexed by the Documents Engine.I can confirm that:- client.documents.retrieve_content() works- client.documents.search() returns the document- last_indexed_time is populated- truncated_content contains extracted textExample document metadata:{ "id": 3652062792350259, "external_id": "HACTL_CSS_Manual", "name": "HACTL_CSS_Manual", "title": "Hactl.md", "mime_type": "application/pdf", "last_indexed_time": "2026-05-06 14:57:28.531+00:00"}However, Atlas AI still responds with:“I could not find any uploaded maintenance manuals related to wheel carriage troubleshooting in the system.”Questions:1. Does Atlas AI automatically use Documents Search semantic indexing from files uploaded with client.files.upload(), or does it require CogniteFile instances + upload_content()?2. Is Atlas AI document retrieval based on: - Documents semantic search - passages/search - or instanceI
Hello all,We are trying to establish connectivity to a source which has cassadra as its backend database. The system allows OPCUA connection but we will have only live data feed that way, without access to historical data.Has anyone explored or tested data extarction from Cassandra. Any inputs would be valuable. Thanks
At the moment, I believe users cannot see which users in their organization are using which CDF features, nor how they are being used.Would it be possible for users with administrator privileges to access this kind of information?If this were available, it would enable us to consider measures to make better use of CDF based on actual usage patterns within our organization. For example:A certain department frequently uses Charts but rarely uses Canvas, so we could interview them to understand the reasons.Specific features of Charts or Canvas are hardly being used, so we could improve the documentation and promote their usage.Although they are not very vocal and we had not noticed before, it turns out that Mr./Ms. △△ is actually a heavy user of CDF, so we could identify them as a key person.If there is already a way to obtain such information, we would greatly appreciate it if you could let us know.
How does asset hierarchy work in CDF?


 Check the
documentation
Check the
documentation Ask the
Community
Ask the
Community Take a look
at
Academy
Take a look
at
Academy Cognite
Status
Page
Cognite
Status
Page Contact
Cognite Support
Contact
Cognite Support