Check the
documentation
Check the
documentation Ask the
Community
Ask the
Community Take a look
at
Academy
Take a look
at
Academy Cognite
Status
Page
Cognite
Status
Page Contact
Cognite Support
Contact
Cognite Support

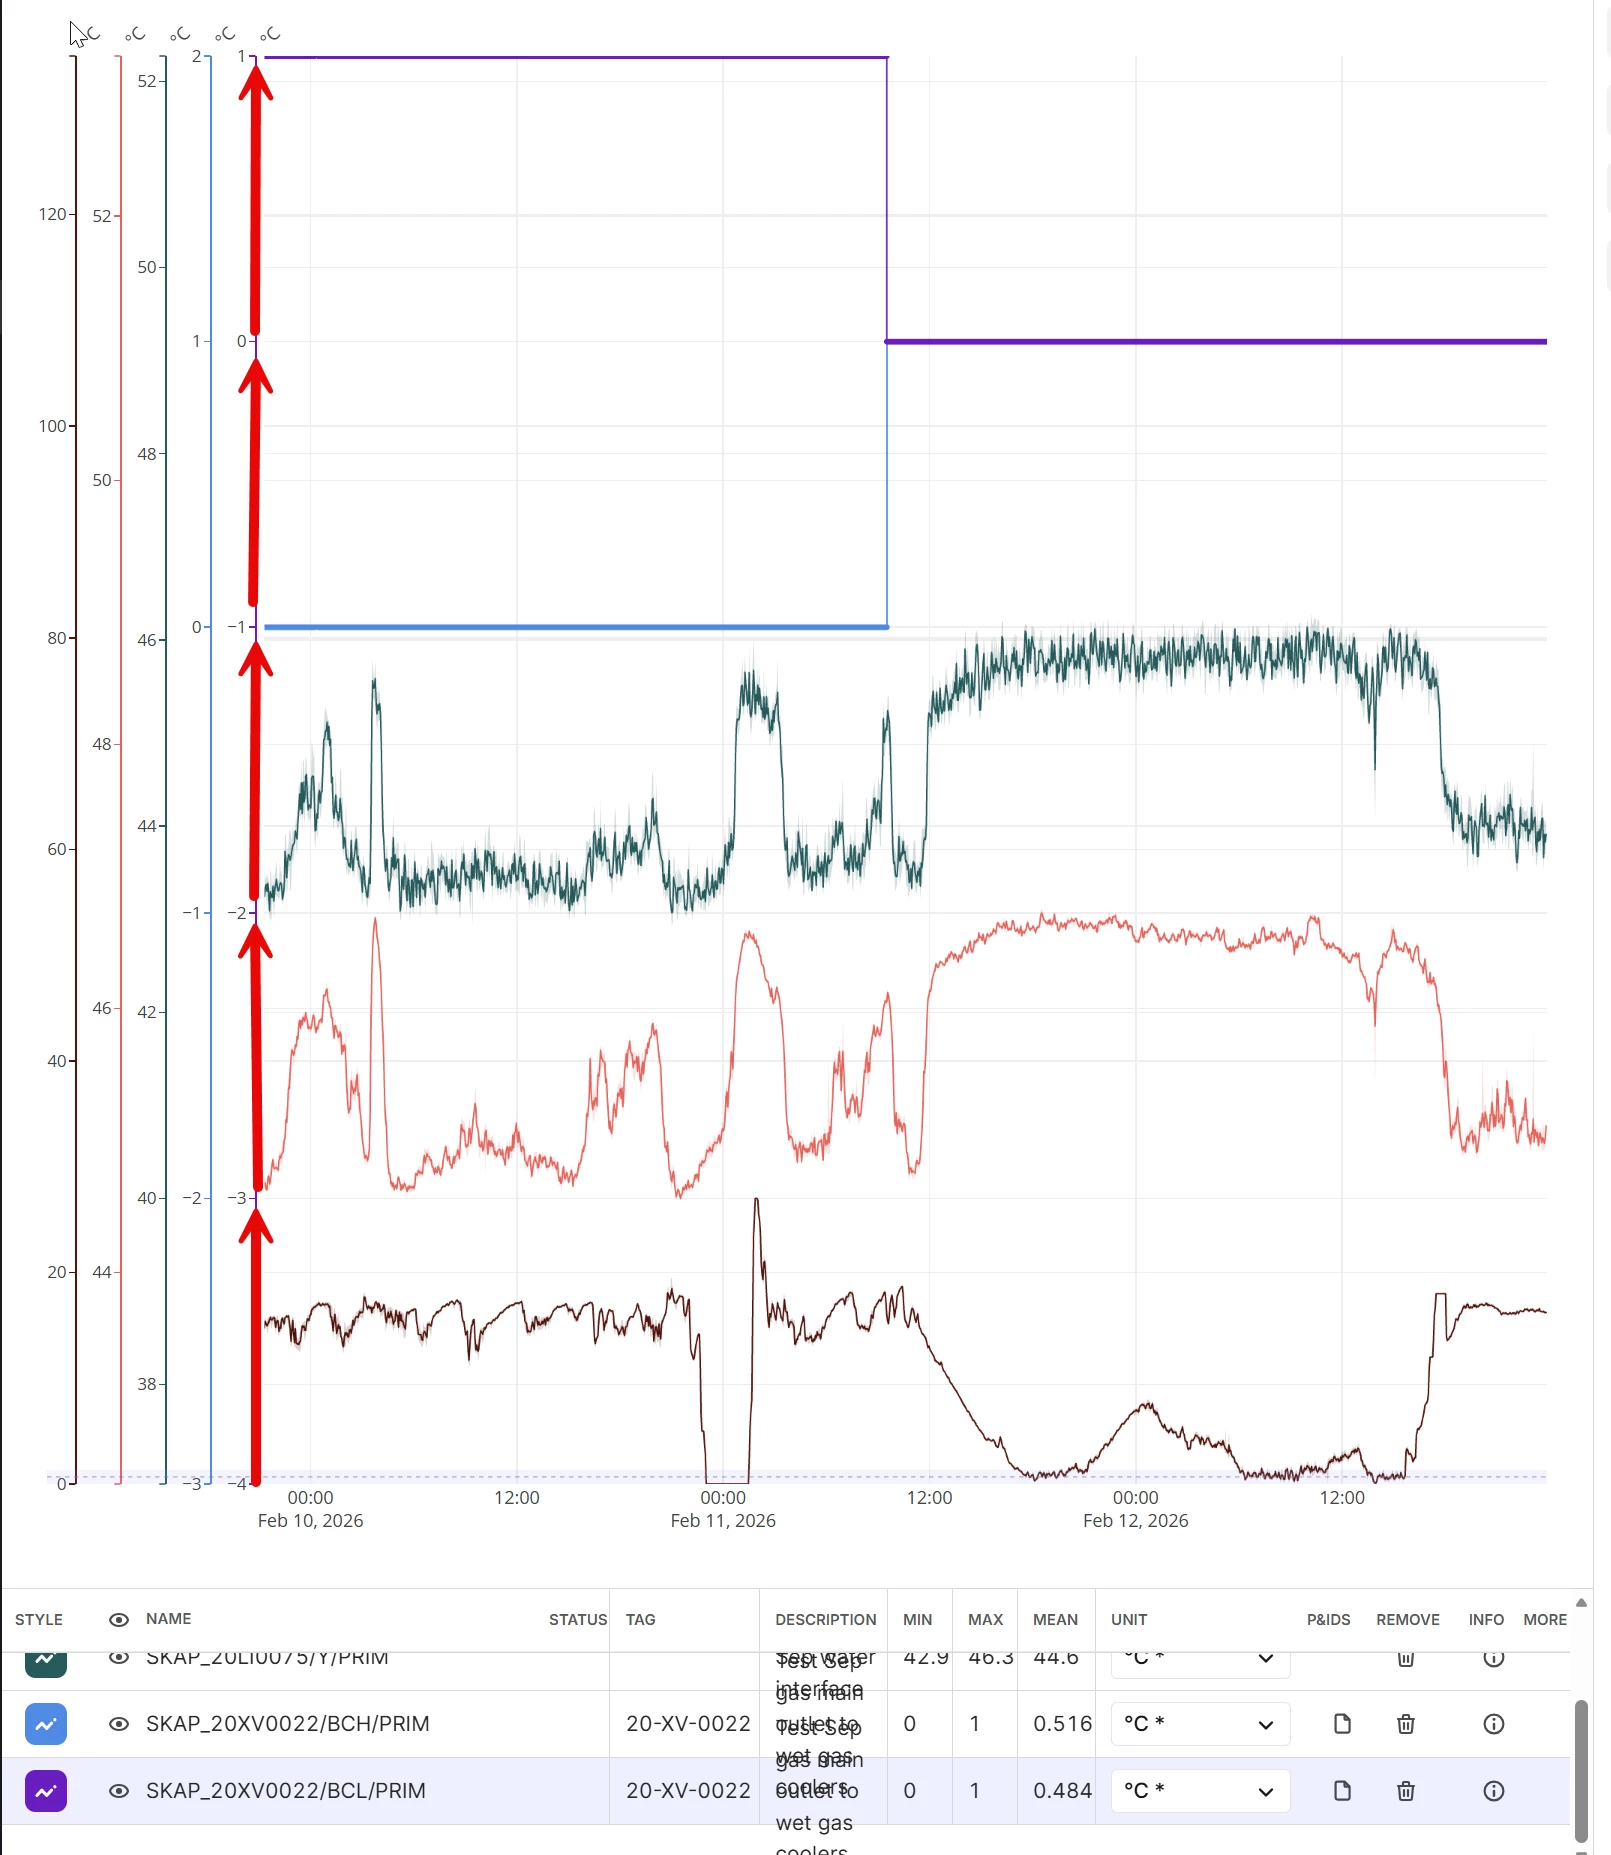
Now, when selecting the stacking function in Charts, all the selected timeseries are combined in the same Y-axis. See attached picture. It is reported by the SMEs that this UI is very messy and hard to read properly. Suggestion to improve this would be a feature where the user can select if he/she want to stack the Y-axes separately (see picture). This would help with better readability of the data in the chart.