Join the conversations to shape a safer, more efficient, and sustainable industrial future!
Recently active
We hit an undocumented behavior of the OPC UA extractor (version 2.38.0, Docker) that we'd like to confirm.Setup: cognite.metadata-targets.clean with assets: true, timeseries: true, relationships: true, plus extraction.update fully enabled. This had been running fine for months — classic asset hierarchy plus classic time series.What we did: we added the GA Core Data Model space option to the same clean block: metadata-targets: clean: assets: true timeseries: true relationships: true space: "<our-instance-space>"What we observed:As documented, time series switched to CogniteExtractorTimeSeries instances in the space, with datapoints available via instanceId. Not documented: classic asset creation stopped entirely, even though clean.assets: true was still set. We verified this by deleting the extractor-managed asset hierarchy and restarting the extractor: after a full startup browse, no assets were recreated — no error, no failure run on the extraction pipeline, nothin
Documents that are most important for the technician should be listed first, e.g. P&IDs (XB).
Hello Cognite team,First of all, thank you for your continuous development and improvements to CDF.I'd like to share one feature request based on our daily use of Charts and Canvas.Our use case In our long-term operation monitoring work, we create multiple Charts for different monitoring items and paste them onto a single Canvas, so that we can monitor many Charts together in one place.The issue The ability to select multiple Charts on Canvas and change their display period all at once is very convenient. However, when we open the same Canvas a month later and refresh to the latest data, the start time stays fixed at the point we originally set. As a result, the displayed time range keeps getting wider and wider over time, instead of showing a consistent window.What we'd like We would like a feature that lets us refresh Charts using the same fixed period — for example, a rolling window of the last 1 month, 3 months, or 1 year — so the time range stays consistent every time we open the
Hi team, we're seeing what looks like a backend issue on westeurope-1 during the Cognite bootcamp.Environment- Cluster: westeurope-1- Projects: cdf-bootcamp-50-prod (also observed in cdf-bootcamp-43-prod)- Time: ~14:40 CEST, 1 Sep 2026Symptom- Transformations and hosted extractors report success / Running, but no instances appear in the data model (Flows/Search is empty).- The datapoints Cognite Function fails when querying the data model: client.data_modeling.instances.list(...) -> CogniteAPIError: Request had 1 constraint violations ... [value must not be null] | code: 400 | cluster: westeurope-1 | project: cdf-bootcamp-50-prod X-Request-ID: 98821131-2f58-9cb9-84bf-b1f9368e4655What we've ruled out- Same code/config works in -test.- Toolkit deploy is green; auth verified; extractors and transformations run without errors.- Instructor indicated westeurope-1 may be having issues.Question- Is there a known incident on westeurope-1 affecting data-model instance writes/reads right no
Who we areWe run a web application for industrial bakery lines that uses CDF as its back end. It's used by both plant operators and management. We're currently migrating our data models to the Core Data Model, and while doing so we've extended it with views of our own — which is what we understood a data model to be for.While migrating we've hit a case where two things we need seem to be mutually exclusive, and we'd like to know the intended pattern.What we needTranslations for some units. Not all of them — a specific set where the label carries meaning for the reader. Our headline case is throughput. We measure, depending on the line and the moment, trays per hour, where a tray may hold several products, or baguettes per hour, or products per hour. #/h is correct dimensionally but doesn't express that variety, and our users need the right word in the right language. (A secondary, milder case: length:kilom has longName: "Kilometer", and there are no accented aliases in the catalogue —
Hi team, I'd like to submit a feature request. Request In Charts, a line is only drawn up to the point where a value is registered in the time series. I'd like an option to draw a horizontal line from the last value up to the current time (NOW). This is especially an issue in calculations. When a formula uses multiple time series that are registered in CDF at different times, the series that ends earlier is plotted only up to its last value, so the calculation result is cut off there. I'd like to avoid this. ExampleGiven two time series Ts_long (up to today) and Ts_short (up to 2025/04/01), using them as calculation sources pulls the output toward the Ts_short time axis, so nothing is displayed after 2025/04/01.Reference テスト Copy(工務 久保田) | Cognite Data FusionCognite Hub
Hi Cognite Community,we currently have a Streamlit Custom App hosted directly in Cognite Data Fusion that we would like to provide to end users for an upcoming testing phase.Our plan is to let the users test the current Streamlit version first, while in parallel we are working on migrating/rebuilding the application as a Flows app.However, this migration will still take some time, while the users are expected to start testing the Streamlit application in approximately two weeks.For the testing phase, we would therefore like to provide users with a direct link to the Streamlit application, but ideally without showing the surrounding CDF navigation/sidebar (Home, Search, Canvas, Charts, Custom Apps, etc.).The goal would be something similar to a standalone/full-screen application experience while still keeping the current Streamlit app hosted and authenticated through CDF.Is there currently any supported way for Streamlit Custom Apps to:hide the CDF shell/sidebar, open the application in
I’m trying to deploy a couple of Streamlit apps into Data Fusion. I’m getting the error “Error during booting up: Program terminated with exit(1)” in the Data Fusion editor portal.I’d swore one app was working yesterday and I was able to publish, but both apps are giving this error in the editor portal. I can publish, but I get the same error in Flows when trying to run the custom app. I’ve tried researching and it says to look at the logs, but I don’t see a way to view any log details.Any thoughts on how to debug this?
To all the experts out there,When parsing a diagram, some annotations may be incorrectly assigned and overlap with the correct ones. For example, "Pump A-1" is correct, while "Pressure Gauge A-1" is incorrect.I want to reject the incorrect "Pressure Gauge A-1" annotation, but I cannot select it because it completely overlaps with the correct "Pump A-1" annotation. As a result, I cannot select and reject the annotation I want to remove. First of all, it is difficult to tell at a glance which annotations are overlapping, as the only indication is a slightly darker color. The annotations I pointed out below are overlapping.I would like it to work like Explorer, as it used to.
I have a workflow that runs subwork flows. In the main workflow, each of the subwork flow tasks is set to ‘skipTask’ on failure. The tooltip notes that the task will be marked as COMPLETED_WITH_ERRORS. However when this happens all I can see for status is ‘Completed’ and no email notification is being set out.What I want is for my workflows to continue to run if a specific portion fails, but I still want the email notification to be sent to notify me that there is an issue.
Allow Custom Symbols for Dataset CategoriesWe would like the ability to assign custom icons or symbols to datasets rather than using the standard black dot that is displayed today.Allowing unique symbols would help users quickly distinguish between dataset types, sources, or business contexts, making the search results easier to scan and navigate. This would improve usability, particularly in environments with a large number of datasets.Expected BenefitsImproved discovery of newly added datasets Reduced user clicks and navigation friction Better visibility into available search content Faster identification of datasets through visual differentiation Improved overall search usability and adoptionThis enhancement would make the search experience more visually intuitive for end users. @Andrew Montgomery
To keep clean structure in Charts monitoring jobs.
The current Cognite Grafana Plugin supports Time Series, Activities, and GraphQL-based queries, but does not provide native access to Records and Streams.As Records and Streams become increasingly important for data ingestion and operational use cases, native support within the Grafana Plugin would enable a more complete and consistent visualization experience directly in Grafana.Requested enhancement:Native querying of Records and Streams from the Grafana PluginSupport for filtering and visualization of Records dataIntegration with Grafana panels and dashboards without requiring intermediary services or custom pluginsThis enhancement would simplify data consumption, reduce implementation complexity, and improve the usability of Records and Streams across operational monitoring and reporting scenarios.
Hi Team,In regards to Cognite Data Model UI we understand that the below features are currently not supported and would like to add them here as a Product Idea requests -Reorder the Sequence of the Views listed in Cognite Data Model UI. For example, Under "Assets" category we have 1) Piping Tag 2) SAP Assets. We would want the "SAP Assets" View to come first followed by the "Piping Tag" View. This would make easier for end users by having important and frequently visited views on top. Also, would reduce the number of clicks a users has to make to get the the required data - for example in Canvas when we want to "Add Data", the default category is set to "Piping Tag" and user has to switch to "SAP Assets" to get to the right view. Option to HIDE some of the views from the Data model UI main/home/landing page. Most of the Views need not be accessible from the Data Model main page and can be accessed through relationships. For example - Under "Activities" category we currently have 11
Hi team,I'm a Cognite Data Fusion (CDF) user, and I'd like to submit a feature request regarding scheduled calculations in Charts that write results to a time series tag.Current behavior (as I understand it) When you set up a scheduled calculation in Charts to store results as a time series, the calculation only runs from the point the schedule is configured onward. It does not compute results for any period before the setup time. I confirmed this behavior in the following Hub post: 🔗 Cognite HubWhat I'd like to see I'd love an option to backfill / calculate historical data retroactively, so that the scheduled calculation can also produce results for the period before the calculation was created.Why this matters With this capability, we would be able to go back and review historical data as well, not just data going forward. This would be very valuable for our long-term monitoring and trend analysis, where being able to look back over past periods is essential.Thank you very much for
**Component**: OPC-UA extractor · `EUInformation` handling **Current behaviour** (confirmed by Cognite): the extractor never reads `NamespaceUri` or`UnitId` from `EUInformation`. The only value that reaches any config surface is thecomposed `DisplayName: Description` string. The UNECE code is dropped before`metadata-mapping` can see it, so `unit` / `unitExternalId` resolution to a`CogniteUnit` from the source unit is impossible today and is not planned. **Request**: carry `UnitId` through, and resolve the CDF `unit` direct relation from it. **Why it matters to us**: across our fleet the `unit` direct relation is populated on**0 of 2772** time series, while 528 of 854 at one line carry the composed string in`sourceUnit`. The only path available is post-processing that string-matches against theCDF unit catalogue. That is brittle in exactly the way a code-keyed lookup is not —`kW·h: kilowatt hour` has to be parsed and matched by display text, and it will differby server locale, by punctu
Hi, could you please help me to register MFA using Cognite to do bootcamp prep hands on session?
Hello, We need to expose our CDF data to a Microsoft Power Apps.The official documentation only covers Power BI and Excel connectors. I found this older thread from 2022 describing how to build a custom connector: https://hub.cognite.com/other-419/how-to-build-a-connector-for-cdf-in-power-apps-cognite-official-1253Few questions:Is there now a native/official CDF connector for Power Apps, or is a custom connector still the only path? If so, is the approach in that thread still valid for current CDF API versions? Any known limitations (authentication, data volume, API compatibility...) to be aware of?Any guidance or pointers to up-to-date documentation would be appreciated.
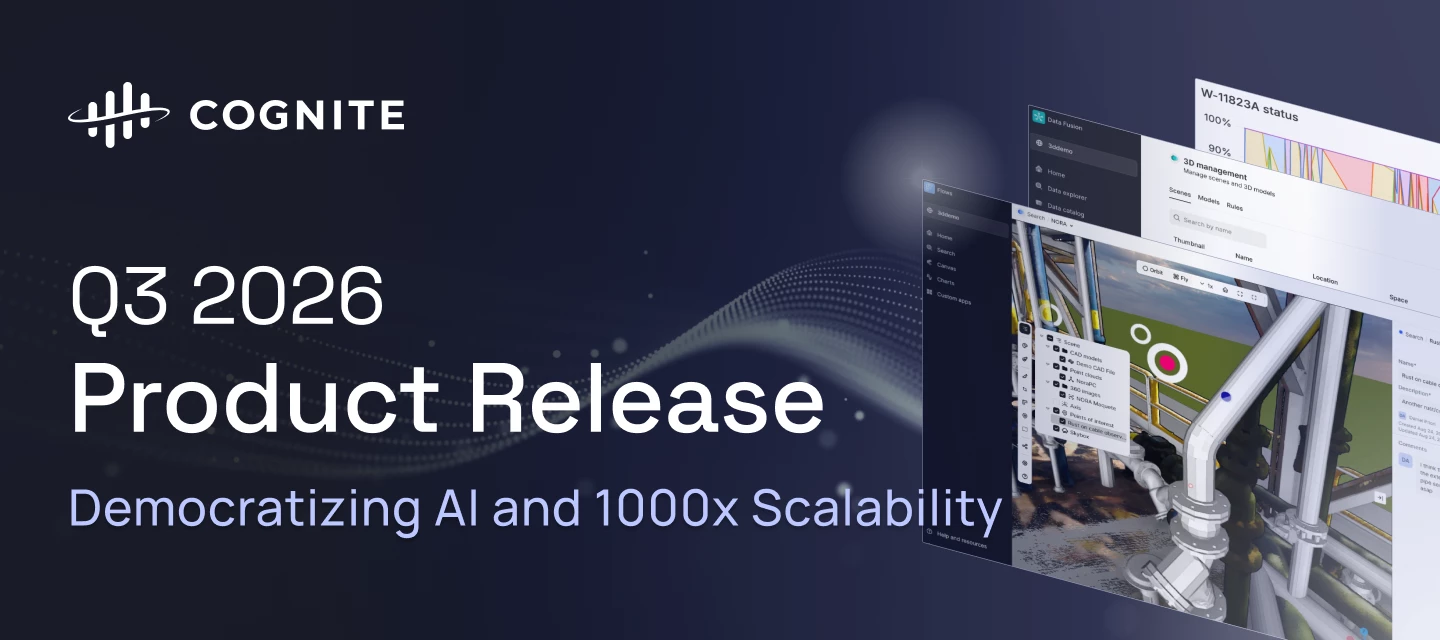
Q3 2026 makes Cognite Data Fusion faster, cleaner, and more autonomous: 3D scenes load and respond quicker, Records connect two-way with the knowledge graph, and any compliant AI agent can plug into your data in minutes, with investigations that used to take a week now taking minutes. Search gets cleaner, Atlas AI gains an open MCP server and a persistent sandbox, Cognite Flows matures across native and custom apps alike, and an open-sourced AI skill pack plus a one-pass Foundation Deployment Pack get new projects running faster than ever.Review the highlights below to see how these advancements accelerate time to value, cut downtime, and expand what your industrial workforce can do.Data Fusion Time Series Gap Filling State Time SeriesPublic Preview General Improvements in Unified 3D and 3D Management Scalability and Performance Improvements in 3D Smarter Search Results: Precision Search Records: Views & Graph Discoverability Atlas AI for Data Fusion Workspace Zero-Copy In
The latest version of the Grafana connector supports unit conversion when CogniteUnit is defined. However, I’m not able to add the target unit to the label. I can add the defined unit using {{unit}}. Using the “Query Inspector” I see that the target unit is returned in the data object via the unitExternalId, but I cannot display it using {{unitExternalId}}. Resulting legend Query inspector resultsI notice that some of the properties can be shown, like type and isStep, but I assume it is because I get it directly from the timeseries instance?Any suggestions to how we can add the target unit (without having to manually write it to the label)?
Hello!We have encountered some issues with backfilling on the PI Extractor. This usually goes automatically, and works fine. However, we do now have a 2 day gap in data on Cognite, however all that data is present in PI.Are there any way to “force” a backfill, or fix this issue somehow?Thanks!
Recently, the use of Charts has been increasing, and more users are creating complex calculations for data visualization.In this context, we have received feedback requesting a “Back” button (undo function).When users are building complex calculation formulas, there have been multiple instances where the calculation source suddenly disappears, forcing them to restart from scratch. The more complex the calculation, the greater the impact of this issue.To mitigate this, it would be extremely helpful to have a function that allows users to go back one step (e.g., an undo or back button).We believe this feature would significantly improve usability and reduce the risk of losing work during calculation editing. Thank you for your consideration.
Hi there, We would like to be able to annotate instances that do not extend CogniteAsset, nor CogniteFile and visualize that in “Preview” in Search UI. Our context is purely data modeling.So we would like to have a view, that extends CogniteDescriable and to be able to annotate it towards a CogniteFile.Currently we are achieving partically that, by having an edge, (pseudo code below) ANNOTATION_TYPE = "diagrams.InstanceLink" type_node = NodeApply(space=REFERENCE_SPACE, external_id=ANNOTATION_TYPE)edge = EdgeApply( space=EDGE_INSTANCE_SPACE, external_id="annotation_<file_ext_id>__<entity_ext_id>", type=DirectRelationReference(space=REFERENCE_SPACE, external_id=ANNOTATION_TYPE), start_node=DirectRelationReference(space=FILE_SPACE, external_id=FILE_EXTERNAL_ID), end_node=DirectRelationReference(space=ENTITY_SPACE, external_id=ENTITY_EXTERNAL_ID), sources=[ NodeOrEdgeData( source=ViewId("cdf_cdm", "CogniteDiagramAnnotation", "v1"),
So, when I get documents to populate in canvas, it drops them off in an unorganized bundle. I tried to get ATLAS to organize them in a timeline but ATLAS states “I can add documents to the current canvas, but I cannot move or rearrange existing canvas elements with the available tools. Please drag the four cards into this left-to-right order:”. Is an update that can make it easier to organized documents in canvas. It gets very cluttered and time consuming to organize these documents when you have like 20-30 documents populating on canvas.
As per the 3D Config feature, it should be good to have a Canvas Config option to configure the colouring for a quick highlight of the contextualization results in a Canvas for P&ID or any “plan” documents like isometrics loaded in a Canvas.In the configuration option we should be able to select attributes/data linked to the OCR captures, then in Canvas we should have a button to select and highlight all the OCR captures contextualized to PI-Tags, 3D tags, WOrkorders, SECE equipments…This option is of importance, it will avoid to check one by one each equipment in a P&ID, it will accelerate the completion of the contextualizations workflows, but not only… it’s also of importance for operations when preparing an intervention.


 Check the
documentation
Check the
documentation Ask the
Community
Ask the
Community Take a look
at
Academy
Take a look
at
Academy Cognite
Status
Page
Cognite
Status
Page Contact
Cognite Support
Contact
Cognite Support