

 Check the
documentation
Check the
documentation Ask the
Community
Ask the
Community Take a look
at
Academy
Take a look
at
Academy Cognite
Status
Page
Cognite
Status
Page Contact
Cognite Support
Contact
Cognite Support
Hei Everyone!
We're excited to announce the latest updates to Charts, designed to enhance your data visualization and analysis experience. In this release, we've focused on improving data viewing capabilities, introducing new features for performance monitoring, and maturing the monitoring and alerting capabilities in Charts. These enhancements are aimed at providing users with greater flexibility, control, and confidence in leveraging Charts for their data-driven decisions.
1. Time Series Status Codes in Charts
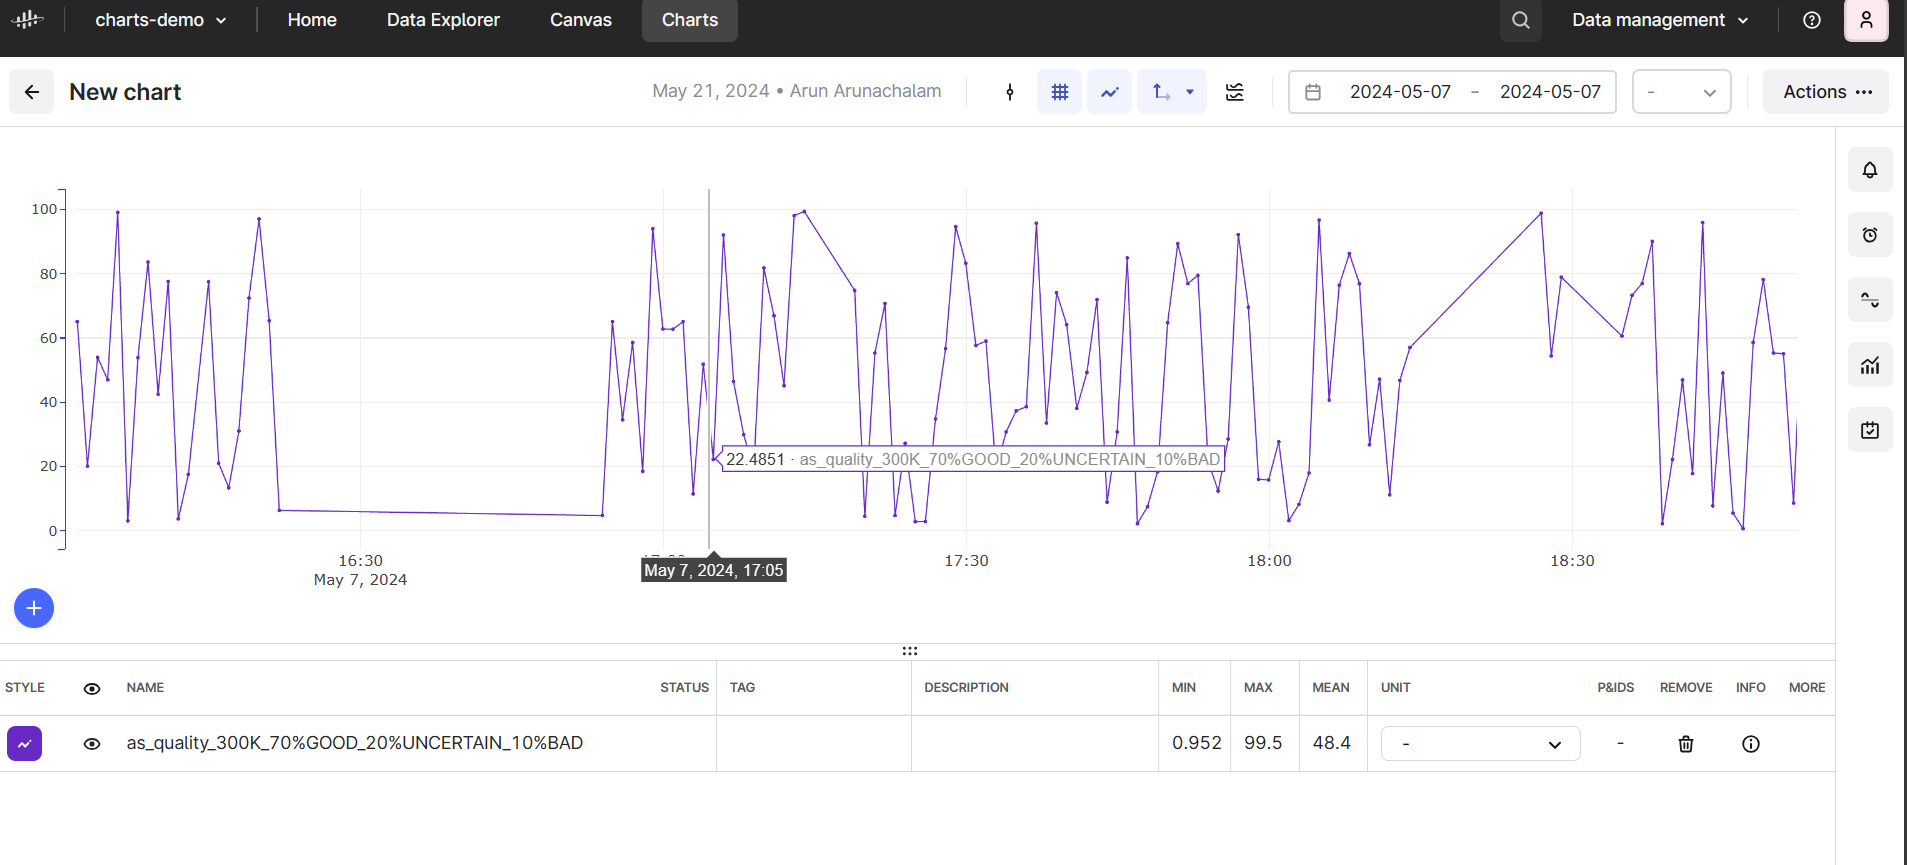
- We’ve enhanced the Charts time series viewer to display not only good data points but also bad and uncertain data. Now, uncertain data points are shown with grey shading, while bad data points are shown as gaps. This improvement enhances trust in our product and allows for more accurate data representation.
Before: If you look at this chart carefully you will notice lines being drawn between gaps leading to an impression that the data is being interpolated. This lead to an inaccurate representation of the data from the source systems in Charts.
After: If you look at this chart carefully you will now notice some visual improvements on the time series viewer. We now show uncertain data points with a grey shading while the bad data is represented as a gap. This leads to a much more accurate representation of the data as seen in the source systems leading to more trust in Charts and a more reliable RCA / troubleshooting job.
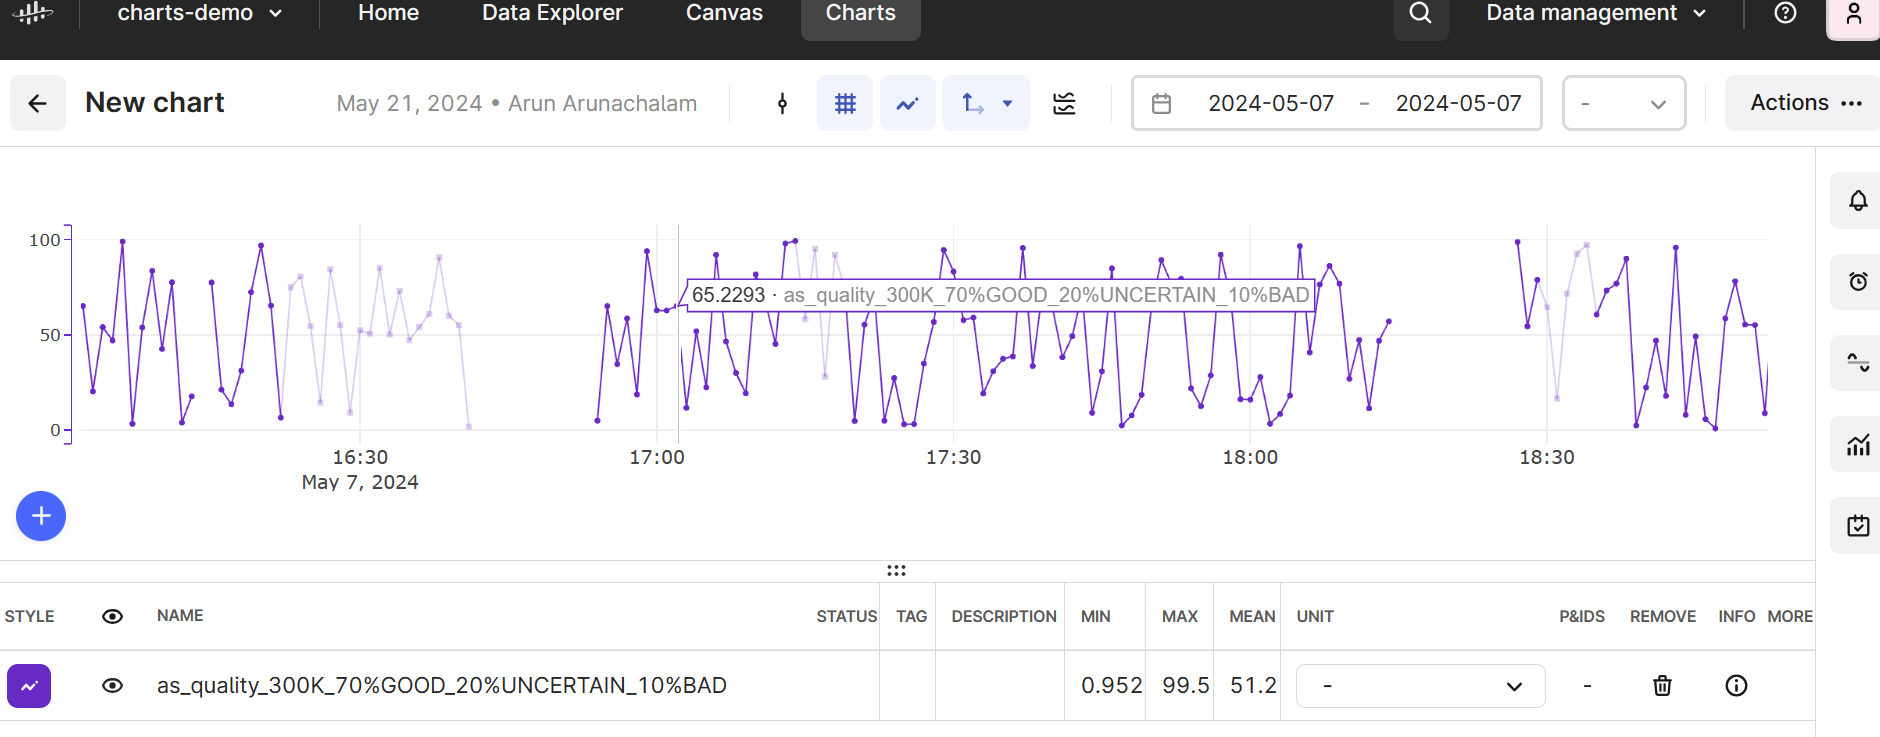
- Note: To enable these indicators, please make sure to contact the relevant CDF individual to help you get this data from your source systems into CDF by updating the extractors.
2. Monitoring and Persisted Calculations in GA
- Both monitoring and persisted calculations have matured from Beta to production.These capabilities are crucial for the troubleshooting/RCA process, and we’re excited about the positive impact on our customer base.
- Learn more:
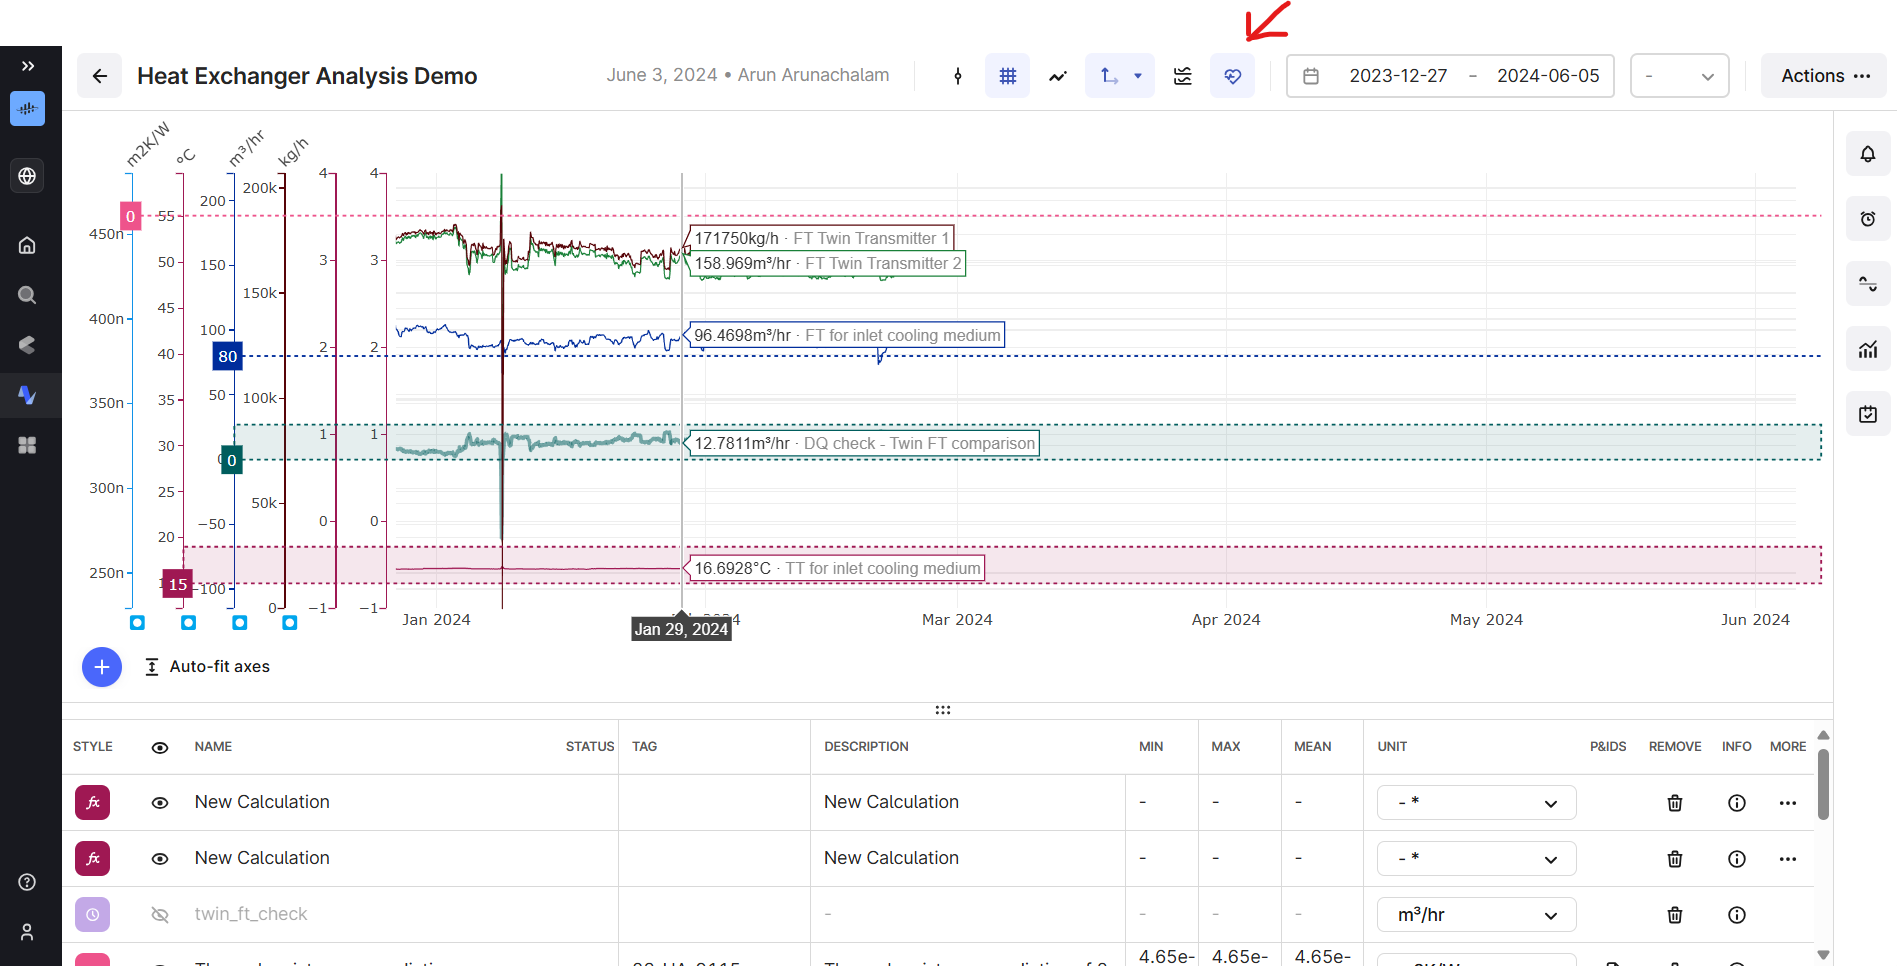
3. Live Mode in Charts
- We’re delighted to introduce Live Mode in Charts! You’ll now see a heartbeat icon on the top side of the Chart bar. Toggling this setting enables auto-refresh, so you can see new data points in CDF automatically without having to move around or click.
Bug Fixes:
- Fixed persisted calculations preview not working: The preview functionality for scheduling calculations now works correctly.
- Fixed an issue causing charts to crash when zooming out: Charts no longer crash due to a stack trace issue when zooming out.
- Plus, we’ve resolved around 35 backend and frontend bugs to improve performance and user experience.
Thank you for your continued support and feedback. We hope you enjoy these new features and improvements. As always, your feedback is invaluable to us.
Happy Charting! The Charts Team
