Check the
documentation
Check the
documentation Ask the
Community
Ask the
Community Take a look
at
Academy
Take a look
at
Academy Cognite
Status
Page
Cognite
Status
Page Contact
Cognite Support
Contact
Cognite Support

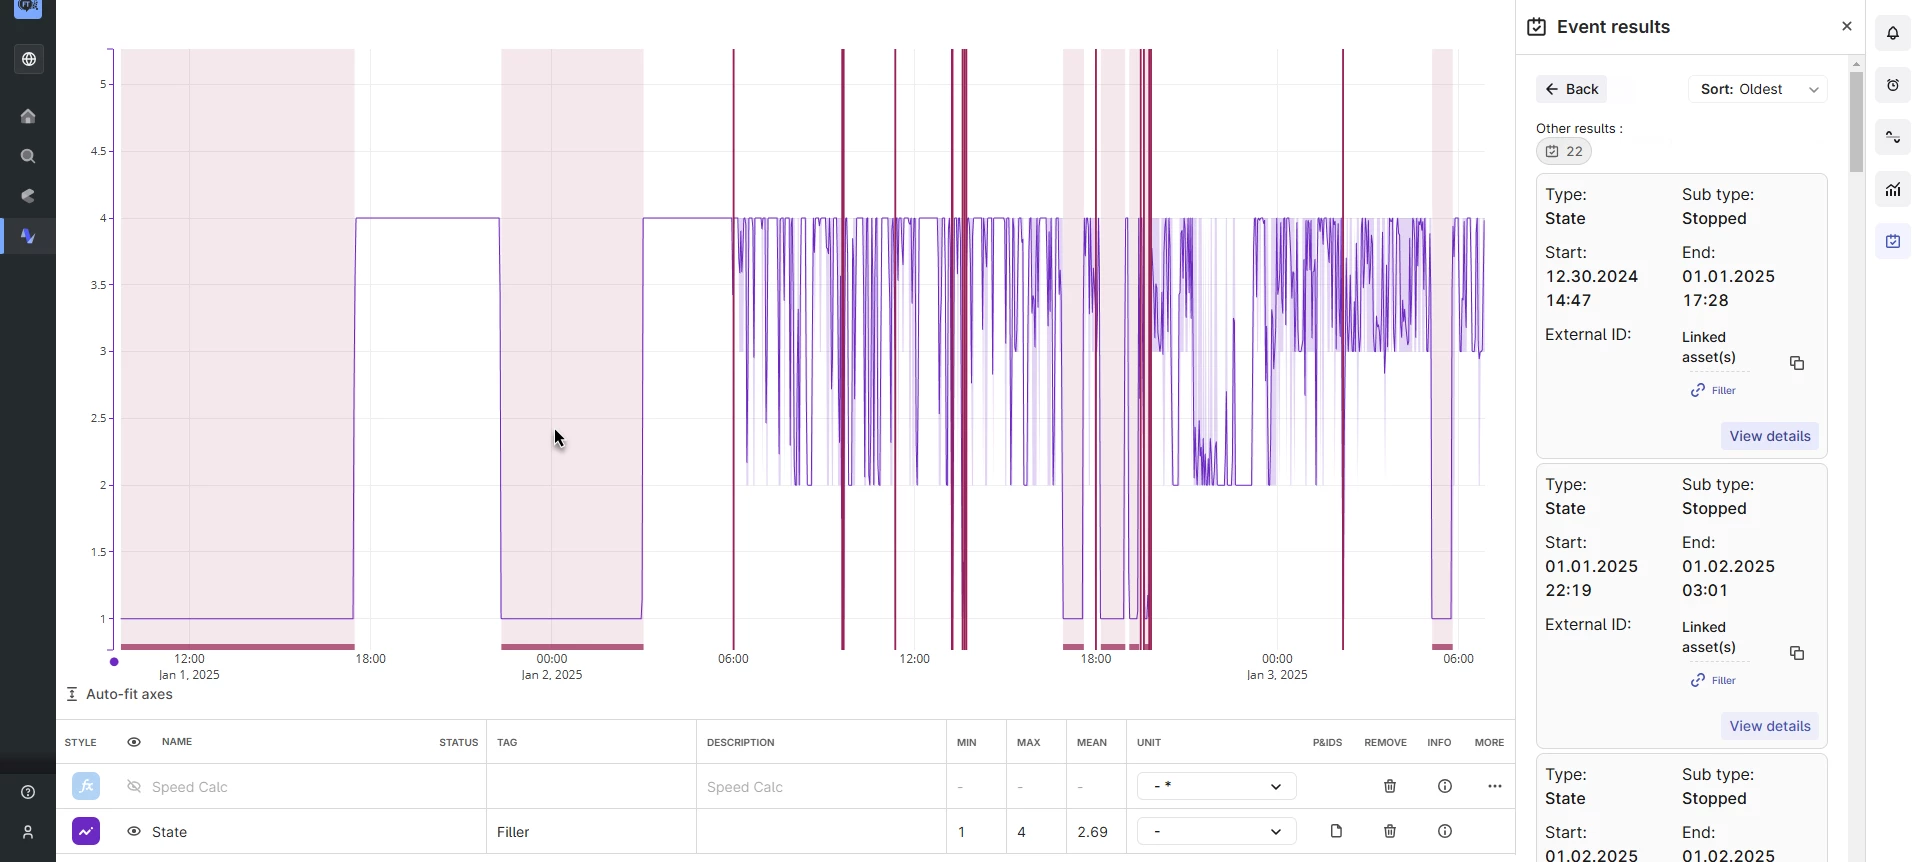
I really like all the current functionality with Events in Charts. Something I’d like to see is the ability to hover my mouse over one of the Events on the Chart (like those shown below) and see a tooltip with information about the Event I’m hovering over. Being able to configure which fields appear in the tooltip would be ideal, but even just showing the fields that are already available in the event results on the right side of the screenshot would be a great start.