Cognite Data Fusion: Charts

Related products: Charts

Celanese - Critical

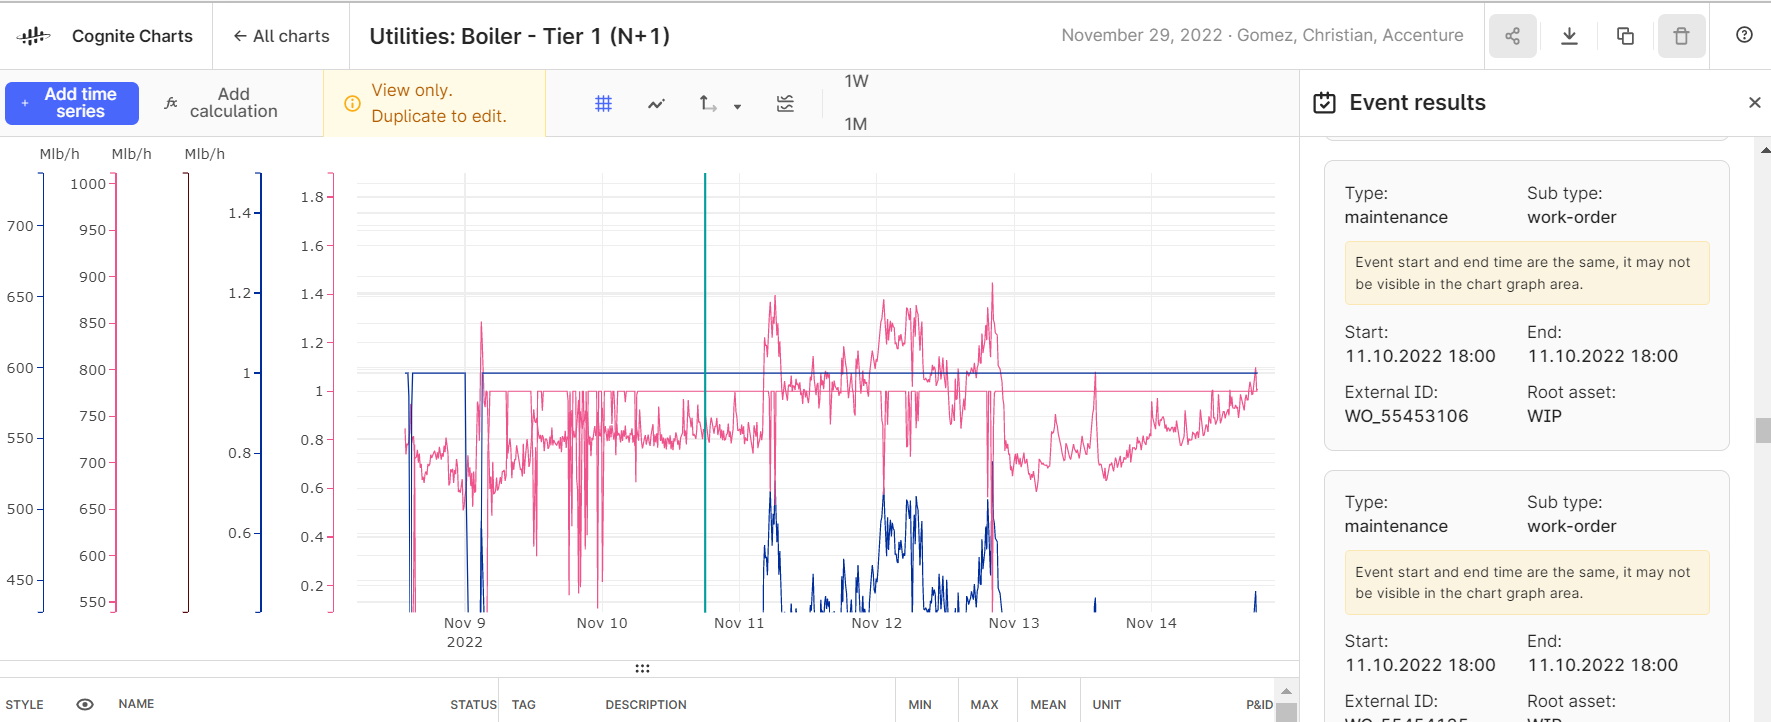
The ability to overlay other transactions on time  series data or create time series from transcations is necessary when troubleshooting. For example, i might be analysing several time series tag and i would like to plot work order and notification dates and/or other events on the same plot. 

This will really help us do better Root Cause Analaysis.

@ibrahim.alsyed 100% agree with and support this request. As I mentioned when we spoke over Teams this week, this is a high priority item on our roadmap. Based on the team’s capacity, I’m anticipating that we’ll implement and release in H2 2022.


Updated idea statusNewPlanned for development

@ibrahim.alsyed, I wanted to follow up on this and let you know that the team and I are starting to actively working on this feature. As we make progress, I’ll share updates in this thread. 


This is absolutely a great feature and requested. Would love to hear how far in the development this has come? 


@haanase absolutely — currently, we are ready to start testing our proposed UI/UX designs. @Magdalena Rut, the designer leading this project, will be reaching out to you soon to schedule a meeting for discussing the Figma prototype and mockups she has created. Magdalena has prepared a few iterations, which also include additional design improvements that we are working on for the upcoming CDF release (early December 2022). 

While we test and agree on the best UI/UX design, the developers on our team have begun the technical planning and backend development work. As of now, we expect to finish implementation in time for the December release.

@ibrahim.alsyed I’ll send you an email next week to arrange a similar meeting with @Magdalena Rut to gather your feedback and input. During that time, we can discuss which of your colleagues at Celanese would also be good candidates to meet with.

Until then, have a great weekend!


@Eric Stein-Beldring - Thank you. Looking forward to it.


@asgottlieb something for you to be involved


@Eric Stein-Beldring 

Great to hear about the progress.

Reach out anytime. Would love to be involved and give feedback! 


As of today’s Cognite Data Fusion release, it is now possible to view events and time series data simultaneously in a plot. Looking forward to hearing your feedback about this first iteration of this functionality in Cognite Data Fusion! 


@Eric Stein-Beldring  This is good step forward but we would need flexibility to select the date and time stamps we want to select. Some times people want to see the created on date of the WO to see when the work order was created as opposed to the date of an exceedance of a time series tag.


@ibrahim.alsyed Thank you for your feedback, it’s very interesting! From design perspective I will be more than happy to talk about it with you soon and dig deeper for better understanding how we can resolve it. It’s seems to be very helpful to clarify vision for next improvements and our direction that we should follow. 

DW: @Knut Vidvei 😊


Planned for developmentImplemented

Hi @Ibrahim Ahmed @Magdalena Rut @Knut Vidvei moving the second request to a separate idea