

 Check the
documentation
Check the
documentation Ask the
Community
Ask the
Community Take a look
at
Academy
Take a look
at
Academy Cognite
Status
Page
Cognite
Status
Page Contact
Cognite Support
Contact
Cognite Support
Hello Charts community,
We have just released a new version of Charts (charts.cogniteapp.com), which is available for all of you to use! Please try it for yourself and, of course, share your feedback here in the Charts group.
You can read more details about this release below. You can also read about the other Cognite Data Fusion features that have been released today here.
Also, remember to join tomorrow's webinar over Microsoft Teams, where we'll be walking through the details of this release and asking for your direct input and feedback. For details and joining info, please visit this post.
Release Details
- A new and improved no-code calculation builder experience (read more below)
- Numerous bug fixes & improvements included in this feature
@Johan this includes the zooming and scrolling functionality that you had requested
- Numerous bug fixes & improvements included in this feature
- Automatic data alignment (read more below)
- Searching for
externalIDin the search bar will highlight when there's an exact match - Updated login page, matching Cognite’s other applications
- Several bug fixes including...
- Fixed bug where calculations would fail if there were less that ±100 data points, even for simple calculations (e.g.
timeseries_1+ 10). Now, calculations will run on as few as 2 data points. - + more
- Fixed bug where calculations would fail if there were less that ±100 data points, even for simple calculations (e.g.
- InDSL (Industrial Data Science Library) updates including...
- New Reindex function (Resample) to reindex data onto a common index and fill missing data points
- New Shift time series function (Operators), which can be used for comparing time series data from different points in time (e.g. comparing time series data from this week’s equipment shutdown with the same time series data from last week’s shutdown)
- Add default parameter values for the Clip function (Operators) — thanks
@Jonas Digernes for your feedback
- New Shut-in variable calculator function (Oil and Gas) to compute the variable of interest at specific times after the shut-in onset
- + more

To discuss the two main features of this release in more detail...
A new and improved no-code calculation builder experience
The no-code calculation builder has been completely redesigned and rebuilt on a new, more powerful library.

This new user experience includes numerous improvements including significantly better usability, zooming in/out, several bug fixes, and more.
This new no-code calculation will also serve as a foundation for exciting and valuable features that leverage this more robust technology.
Note: This new no-code calculation builder will work on all newly created calculations in your charts. This means that, if you created a calculation in the old node editor, you’ll have to re-create it in a new calculation.
Automatic data alignment
Working with time series data is not a simple task.
Time series have differences in sampling frequencies and time stamps. This can make it a painstaking process to do even the simplest of calculations (e.g. timeseries_1 + timeseries_2), especially if you’re not proficient in python.
Data alignment is needed for every source in every single calculation. Without properly accounting for data alignment, calculation results will be inaccurate and untrustworthy.

Charts will now automatically handle data alignment in your calculations so you can spend more time performing industrial data analytics and less time worrying about data alignment.
Cognite’s data scientists have created data alignment algorithms for resampling and reindexing, where the parameters adjust to fit the data you’re working with and the calculation you’re building.
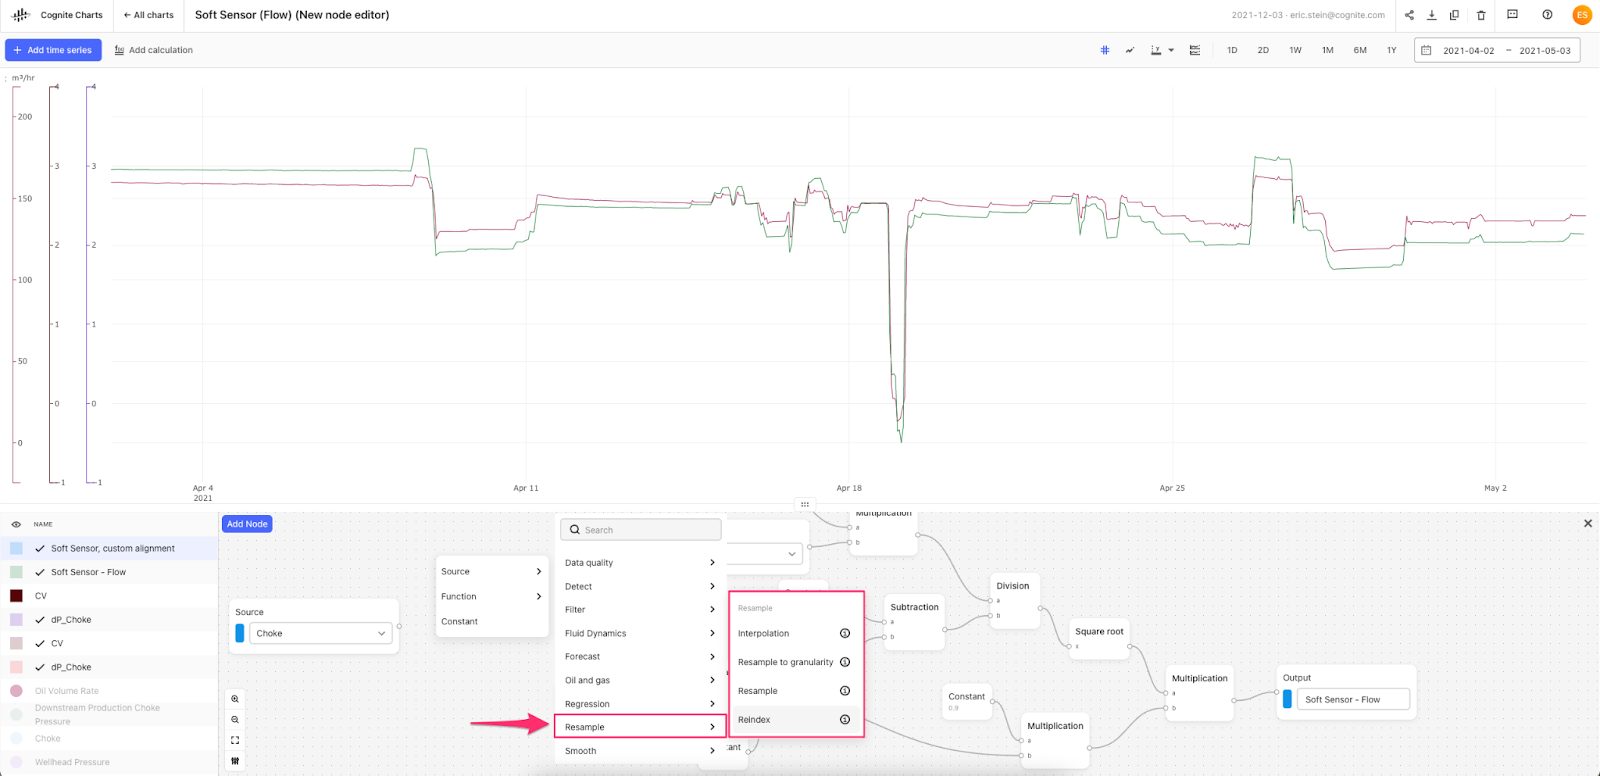
For those who want full control over the data alignment in a calculation, you can use the functions in the “Resample” toolbox to define the parameters as you see fit.

Thanks and see you at tomorrow’s webinar!
Eric & the Charts Team @ Cognite