Answer

Empty time series after insert datapoints

  • March 1, 2024
  • 3 replies
  • 56 views

Hi guys, 

Could you please help me find out why it still shows empty time series even though I have insert data points?


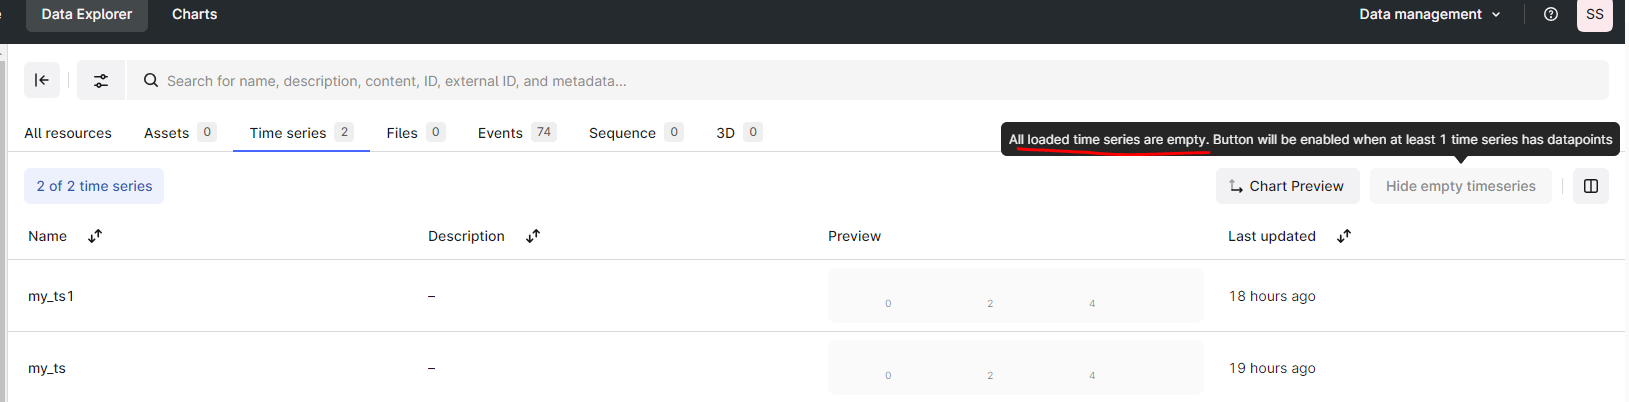
I am able to list the data points in “my_ts1” time series with API but I can’t view them in chart.

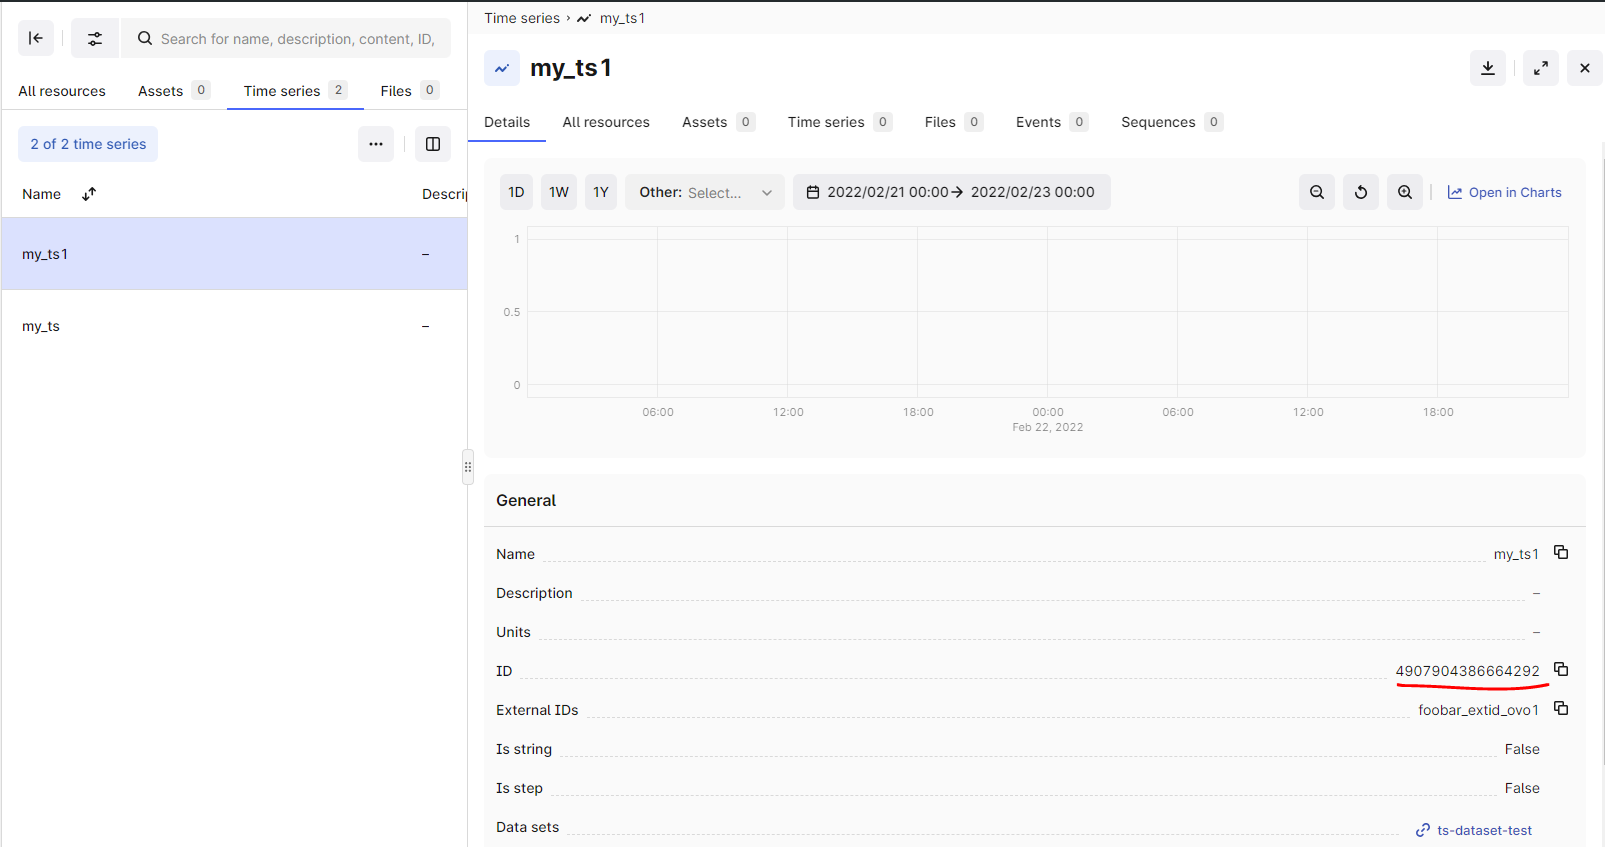
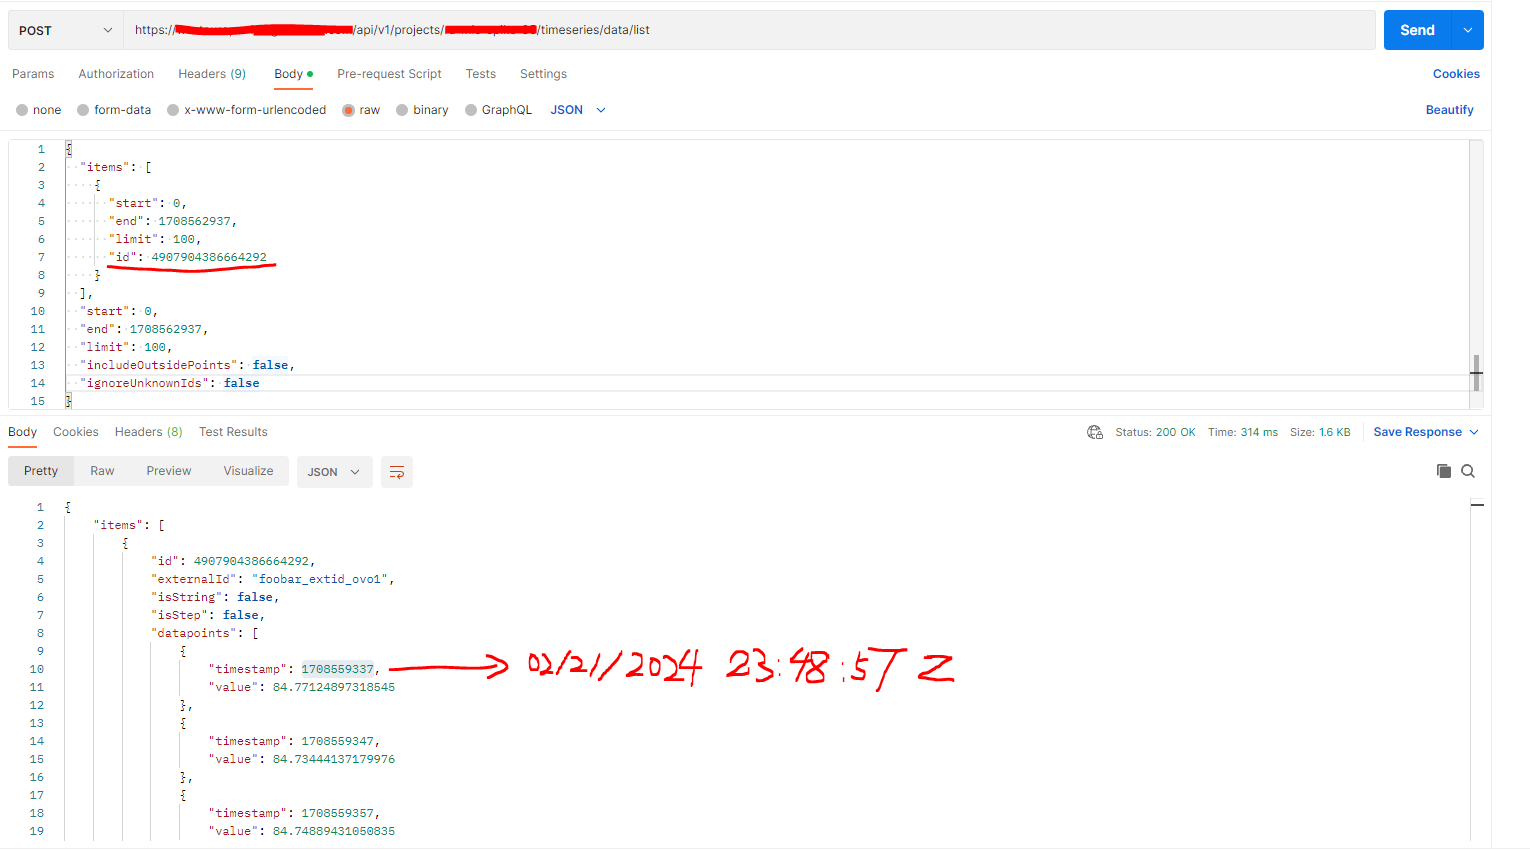
How can I view the time series data in chart? Thanks a lot!

Best answer by Fredrik Holm

Hi Jasmin.


Please note that timestamp for datapoints is stated in milliseconds since the Epoch (Jan 1, 1970).

So the timestamp you should insert is probably something like 1708559337000.

Kind regards,

Fredrik

3 replies

Forum|alt.badge.img
  • Practitioner
  • Answer
  • March 1, 2024

Hi Jasmin.


Please note that timestamp for datapoints is stated in milliseconds since the Epoch (Jan 1, 1970).

So the timestamp you should insert is probably something like 1708559337000.

Kind regards,

Fredrik


  • Author
  • Active
  • March 1, 2024

Hi Jasmin.


Please note that timestamp for datapoints is stated in milliseconds since the Epoch (Jan 1, 1970).

So the timestamp you should insert is probably something like 1708559337000.

Kind regards,

Fredrik

Thanks Fredrik! That makes sense,  I’ll check it later.


  • Author
  • Active
  • March 5, 2024

Solved. As  @Fredrik Holm said, the timestamp should be in milliseconds. It works now, thank you so much! You save my day.