Check the
documentation
Check the
documentation Ask the
Community
Ask the
Community Take a look
at
Academy
Take a look
at
Academy Cognite
Status
Page
Cognite
Status
Page Contact
Cognite Support
Contact
Cognite Support
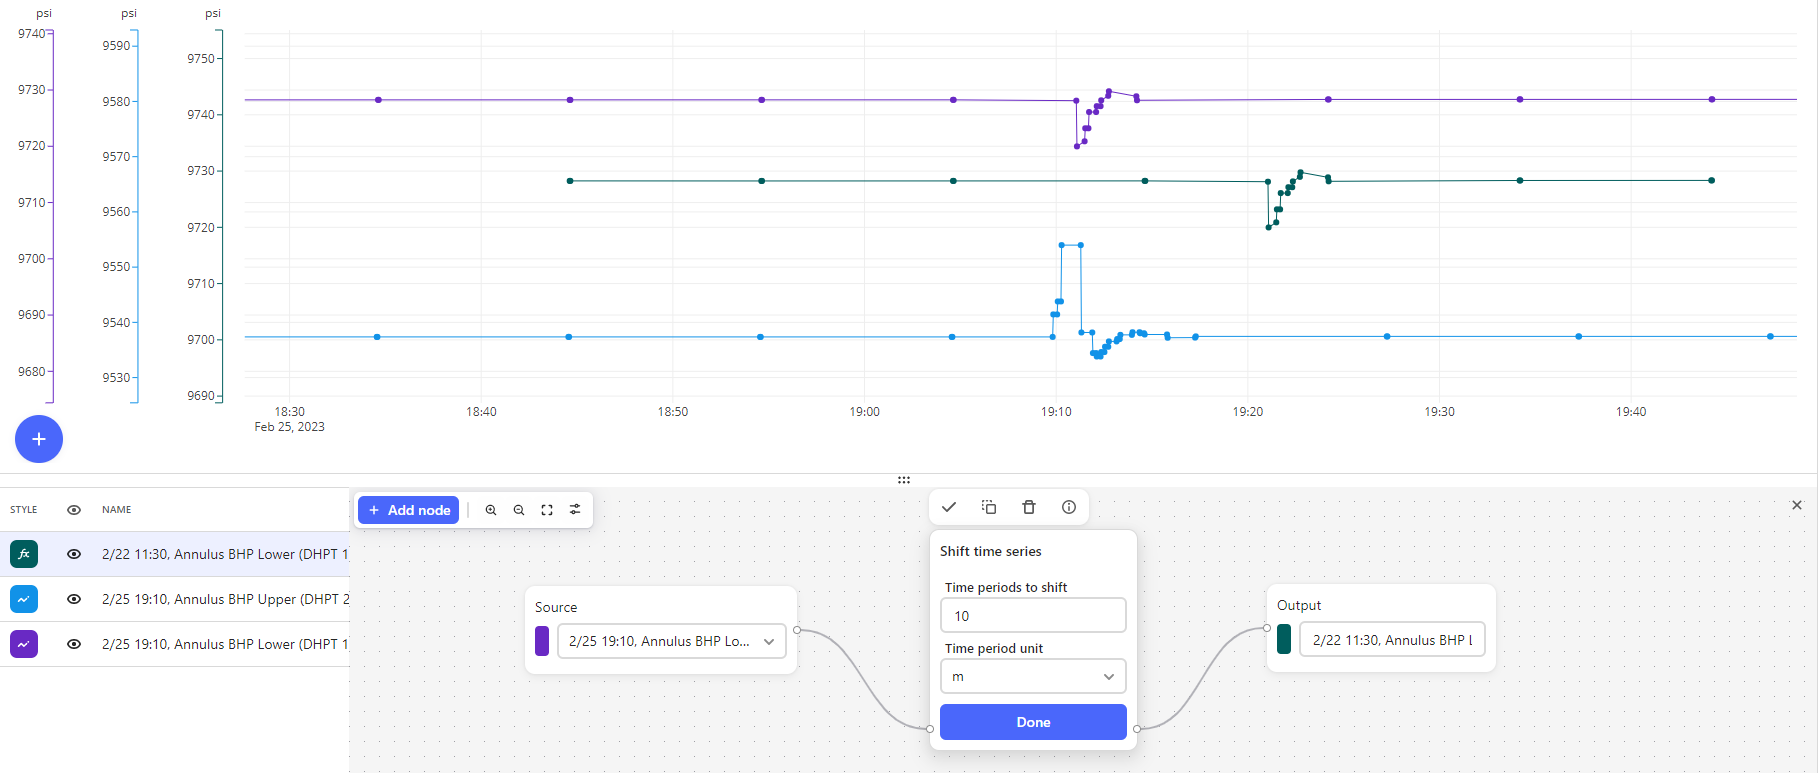
In Charts, we have been using the “Shift Time Series” function (for creating a new Calculation time series) to assess data more effectively, but have now noticed a limitation where the calculation is limited to the data from the source time series already displayed. If you look at the first image below (just a 10-min shift), you can see in the green calculation that there is a gap on the left where the calculation doesn’t exist due to the source data being “off the page”. If we go to a more extreme scenario (2nd image below), now of the data shows since we are attempting a 2+ day shift in a time series. Is there a solution where this limitation can be removed?
For our scenario specifically, we are looking closely at (and comparing) three separate incidents that lasted about 1 minute each, but were spread out over the course of a week, so we are super zoomed in to look at the behavior signatures. Thanks for the input!
Kind regards,
Richard