Check the
documentation
Check the
documentation Ask the
Community
Ask the
Community Take a look
at
Academy
Take a look
at
Academy Cognite
Status
Page
Cognite
Status
Page Contact
Cognite Support
Contact
Cognite Support

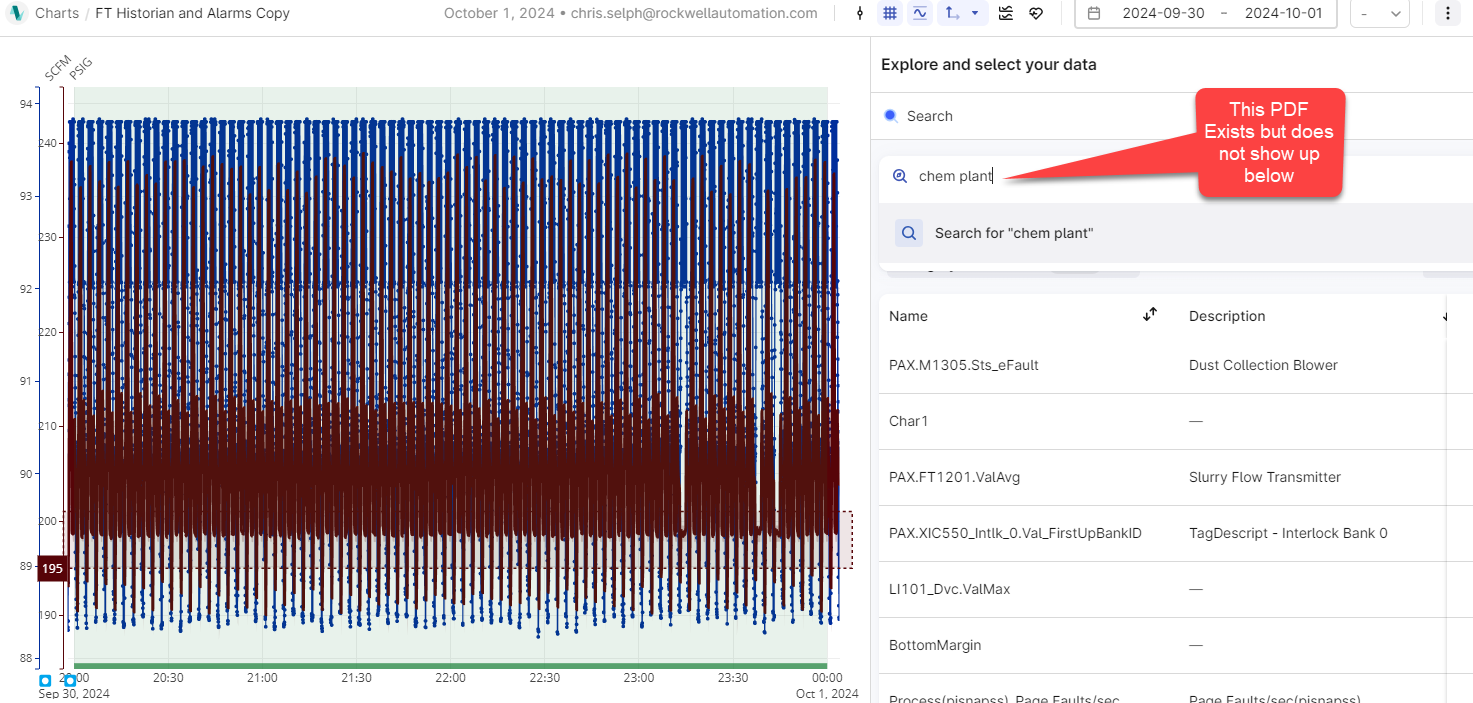
Recently the user interface in Charts has changed. I’m not seeing the ability to add timeseries via a PID in a contextualized PDF file. See the image below. Is that capability not available any more?
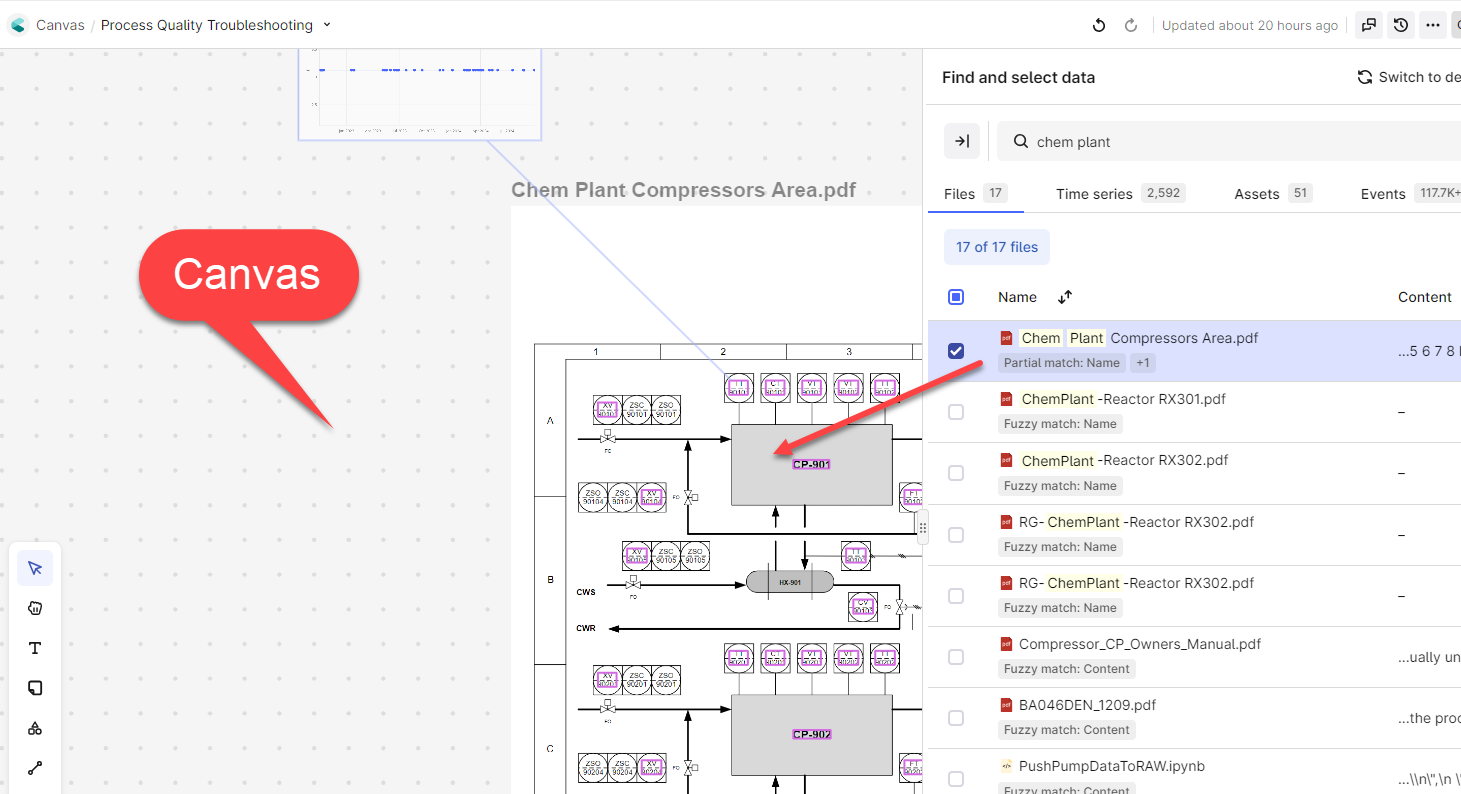
You can see the PDF from the Industrial Canvas UI: