Gathering Interest

【Charts】Feature Request: Allow defining start/end points in Charts calculation formulas

Related products:Charts
  • June 11, 2026
  • 4 replies
  • 57 views

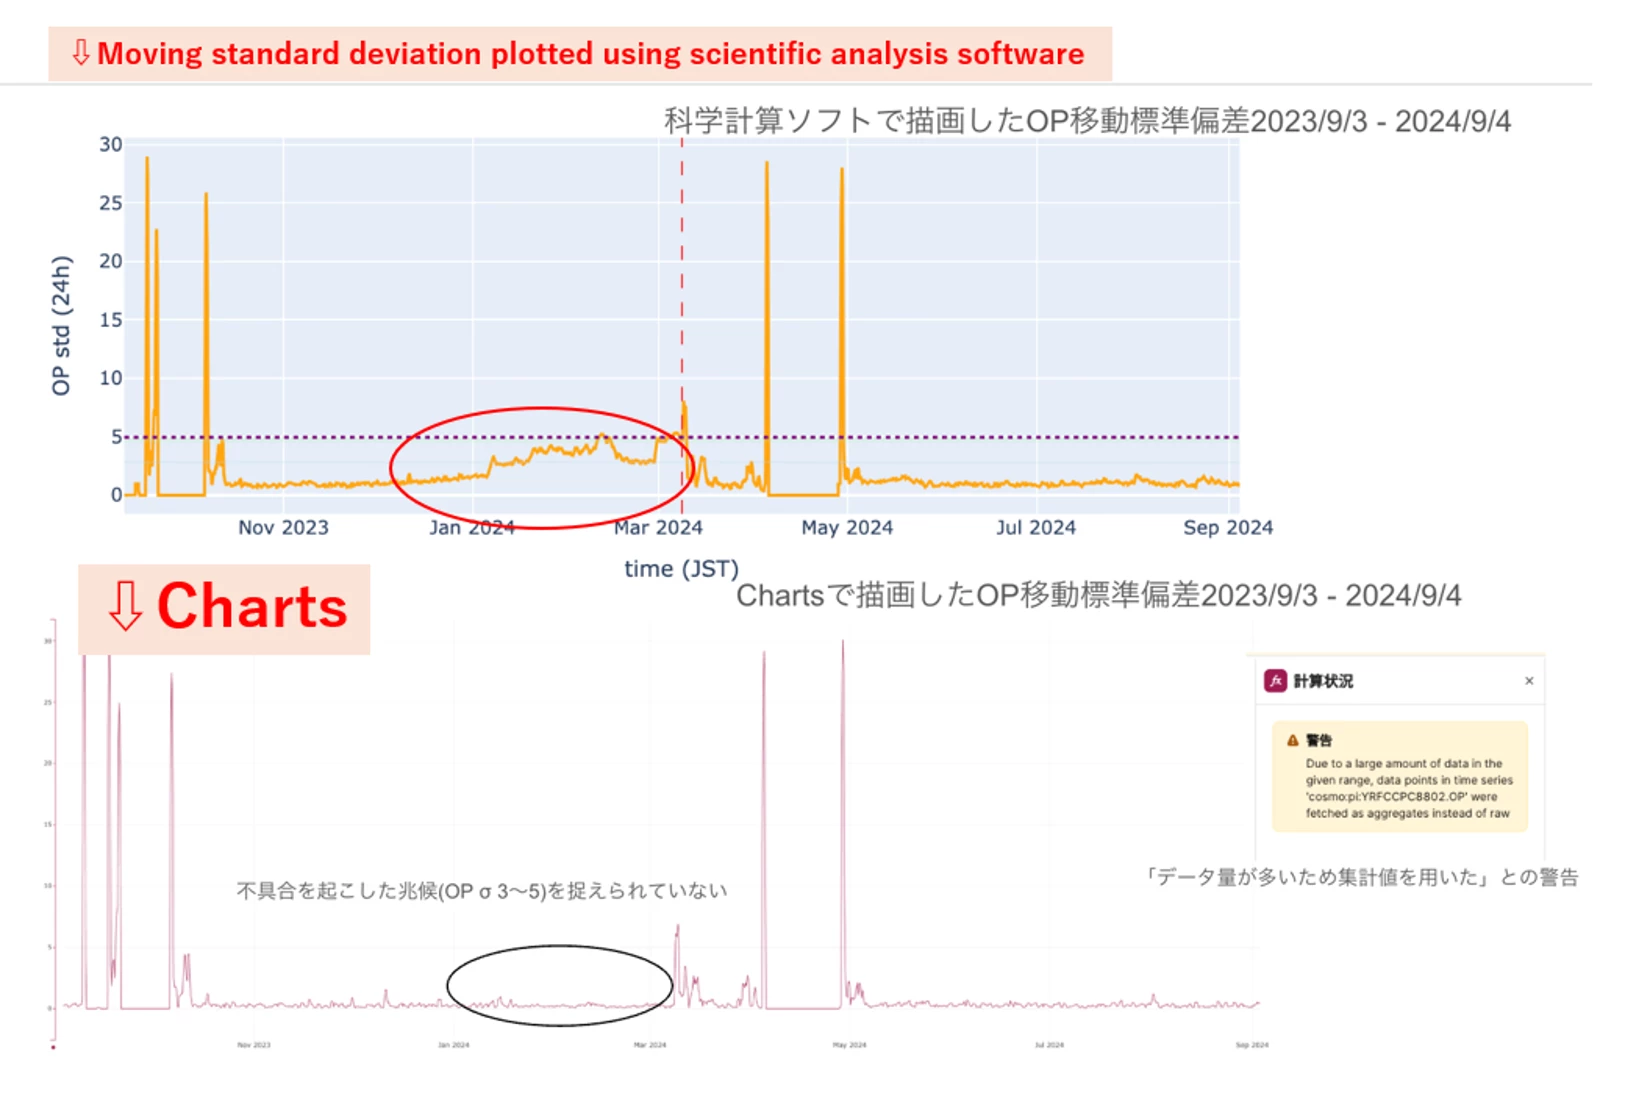
I would like to submit a product idea regarding Charts calculations.

Currently, calculations in Charts are performed only within the time range that is visible on the screen. We would like to request an enhancement that allows users to define a specific calculation period (i.e., start and end points) directly within the calculation formula.

For example, when using the “sample average” operator, the result is calculated only based on the data currently displayed. As a result, the calculated value changes when the user scrolls or shifts the visible time range.

We would like to be able to calculate metrics such as average values over a fixed, explicitly defined time range, including data outside of the current view. This would ensure that the result remains consistent and is not affected by scrolling or changes in the displayed window.

We believe this functionality would significantly improve usability and enable more stable and meaningful analysis.

Thank you for your consideration.

4 replies

Shun Takase
MVP ⭐️⭐️⭐️⭐️⭐️
Forum|alt.badge.img
  • MVP ⭐️⭐️⭐️⭐️⭐️
  • June 11, 2026

I also agree with this opinion.
Personally, when calculations using moving averages are scheduled, the results written can be incorrect depending on the moving average settings. This creates a risk that users may view these incorrect results and make wrong decisions.

Since moving average functions are also frequently used, I strongly hope that this behavior will be improved.


Everton Colling
Expert ⭐️⭐️⭐️⭐️
Forum|alt.badge.img
  • Expert ⭐️⭐️⭐️⭐️
  • June 12, 2026

Hi ​@Kubota Mami!

Thank you for suggesting this product idea. We will follow the traction this idea gets in the community. You can expect updates on this post if we decide to include this in our future roadmap, or if we require more information.


danielferraz
Expert ⭐️⭐️⭐️⭐️
  • Expert ⭐️⭐️⭐️⭐️
  • June 16, 2026

Hi ​@Kubota Mami and ​@Shun Takase 

Thank you very much for the request here. This is a fair request, and I can definitely see the value of viewing calculated data outside of the current chart view. 

A few questions from my side:
a) Is the most common calculation function for this particular need “moving averages”? Or does it extend to other calculation functions? 
b) Would configuring the calculation node be a fix here? For example, opening the “moving average” function node in the calculation UI and configuring the fixed time range to ensure that data outside the current view is included? 

We will evaluate this improvement and keep this post updated once I have a better sense of the timelines. 

Daniel Ferraz 
Product Manager 


  • Author
  • Seasoned ⭐️⭐️
  • June 25, 2026

Hi ​Mr @danielferraz ,

 Yes, moving averages are the most common example, but we have also encountered similar issues with moving standard deviation calculations.

One related challenge is that I recently created a time-series chart to monitor control valve hunting behavior. When the chart is opened over a wide time range in Charts, aggregated data is used instead of the underlying raw data. As a result, an increasing trend that should be visible—as confirmed by our scientific analysis software—appears flattened in Charts and can no longer be recognized clearly (although Charts appropriately displays a warning that aggregated values are being used).

Therefore, our concern is not limited to calculating moving averages using data outside the visible time range. We also face challenges where important trends or statistical characteristics become obscured when calculations are performed on aggregated data.

I assume this behavior is intended to improve performance by reducing the number of API calls and the amount of data retrieved. In many cases, this is beneficial because it allows charts to load more quickly. However, for certain analyses, we would prefer to use raw data and include information outside the currently visible time range, even if the calculation or chart loading takes longer.

It would be very helpful if users could optionally choose a more accurate calculation mode for specific use cases. For example, I would be willing to wait longer if Charts could retrieve the required raw data through multiple API calls and perform calculations using the complete dataset rather than aggregated values. For engineering analysis and condition monitoring, accuracy is sometimes more important than loading speed.

It is possible that some of the points above are slightly outside the scope of the original discussion, so I apologize if I have drifted from the main topic. I simply wanted to share a related challenge that we have encountered in practice.