Markus Pettersen
MVP ⭐️⭐️⭐️⭐️⭐️
MVP ⭐️⭐️⭐️⭐️⭐️
October 27, 2025
Implemented

Search UI improvements for time series visualization

Related products:ChartsSearch UI
  • October 27, 2025
  • 6 replies
  • 78 views

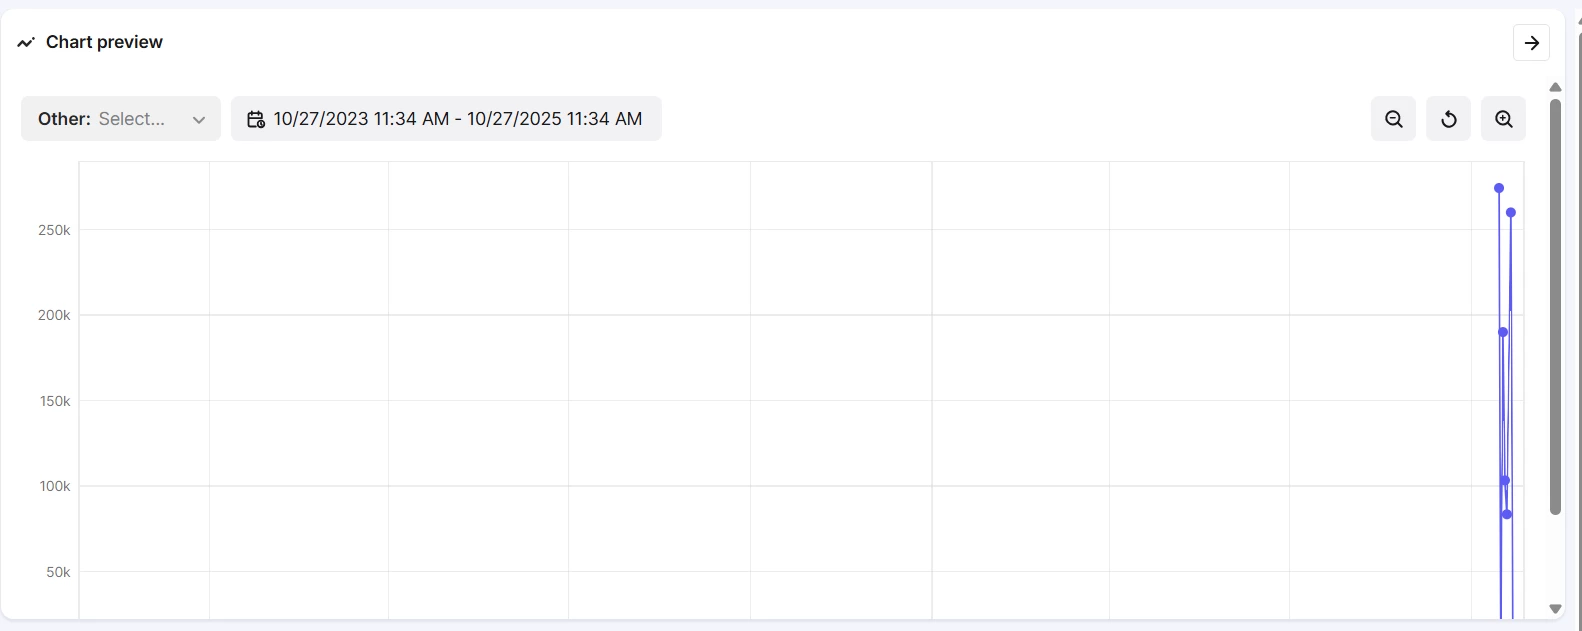
Scaling the y-axis to show the whole graph rather than scrolling. Needing to scroll to be able to see the x-axis is not very user friendly. If the chart doesn’t fit the frame then the chart should be resized rather needing to scroll.
 

Markus Pettersen
Aker BP - Data Platform Architect

6 replies

Markus Pettersen
MVP ⭐️⭐️⭐️⭐️⭐️
MVP ⭐️⭐️⭐️⭐️⭐️
October 27, 2025

I see no way to be able to see the whole preview at the same time, I have to choose whether I want to see the x-axis or the toolbar at the top.

Jørgen Lund
Expert ⭐️⭐️⭐️⭐️
Product Manager
October 27, 2025

Hi ​@Markus Pettersen !

Thank you for suggesting this product idea. We will follow the traction this idea gets in the community. You can expect updates on this post if we decide to include this in our future roadmap, or if we require more information

Sofie Svartdal Berge
Expert ⭐️⭐️⭐️⭐️
Expert ⭐️⭐️⭐️⭐️
October 28, 2025

Hi ​@Markus Pettersen !
Something is off there. We will absolutely fix. Thank you for letting us know!


Best, 

Sofie, Product Manager

Sofie Svartdal Berge
Expert ⭐️⭐️⭐️⭐️
Expert ⭐️⭐️⭐️⭐️
December 8, 2025

Hi! 
This is now fixed. 


Best regards, 

Sofie

Markus Pettersen
MVP ⭐️⭐️⭐️⭐️⭐️
MVP ⭐️⭐️⭐️⭐️⭐️
January 6, 2026

Thanks, I can confirm the fix works as expected on our end

Sofie Svartdal Berge
Expert ⭐️⭐️⭐️⭐️
Expert ⭐️⭐️⭐️⭐️
January 6, 2026

Glad to hear, ​@Markus Pettersen ! Thank you for confirming. 

//Sofie