

 Check the
documentation
Check the
documentation Ask the
Community
Ask the
Community Take a look
at
Academy
Take a look
at
Academy Cognite
Status
Page
Cognite
Status
Page Contact
Cognite Support
Contact
Cognite Support
CHARTS AND THE CHARTS EARLY ADOPTER GROUP
Want to become an early adopter and learn more? Join this session and learn how you can join our early adopter group here on the Hub! You can request to join the group here.
Join us for this live webinar hosted by Customer Success and members of the Product Development team to present the latest CDF release, with a special focus on Cognite Charts and the Charts Early Adopter Group. You will learn about why we’re building Charts, what problems it can solve, and how to use key features and functionalities. In this session, you’ll also have the opportunity to join our private early adopter group for Charts. This is the first webinar in our Product Release Spotlight series.
You’ll see how to leverage this new CDF functionality as we build and solve real use cases in Charts step by step. From finding the relevant data, to using P&IDs to gain a systems understanding, to configuring the chart, to creating the no-code calculations to solve the problem at hand. This will be an interactive session for asking questions, discussing ideas, and providing feature requests directly with the team. By the end of this session, you’ll feel confident about using Charts in your day-to-day work and feel empowered to think creatively about the solutions you could build to shape a safer, more efficient, more sustainable industrial future.
You’ll find our October product release notes here.
IN THIS WEBINAR
Eric Stein-Beldring, Senior Product Manager, Cognite
Knut Vidvei, Product management Lead Data Science Journey, Cognite
Alex Farmer, VP Customer Success, Cognite
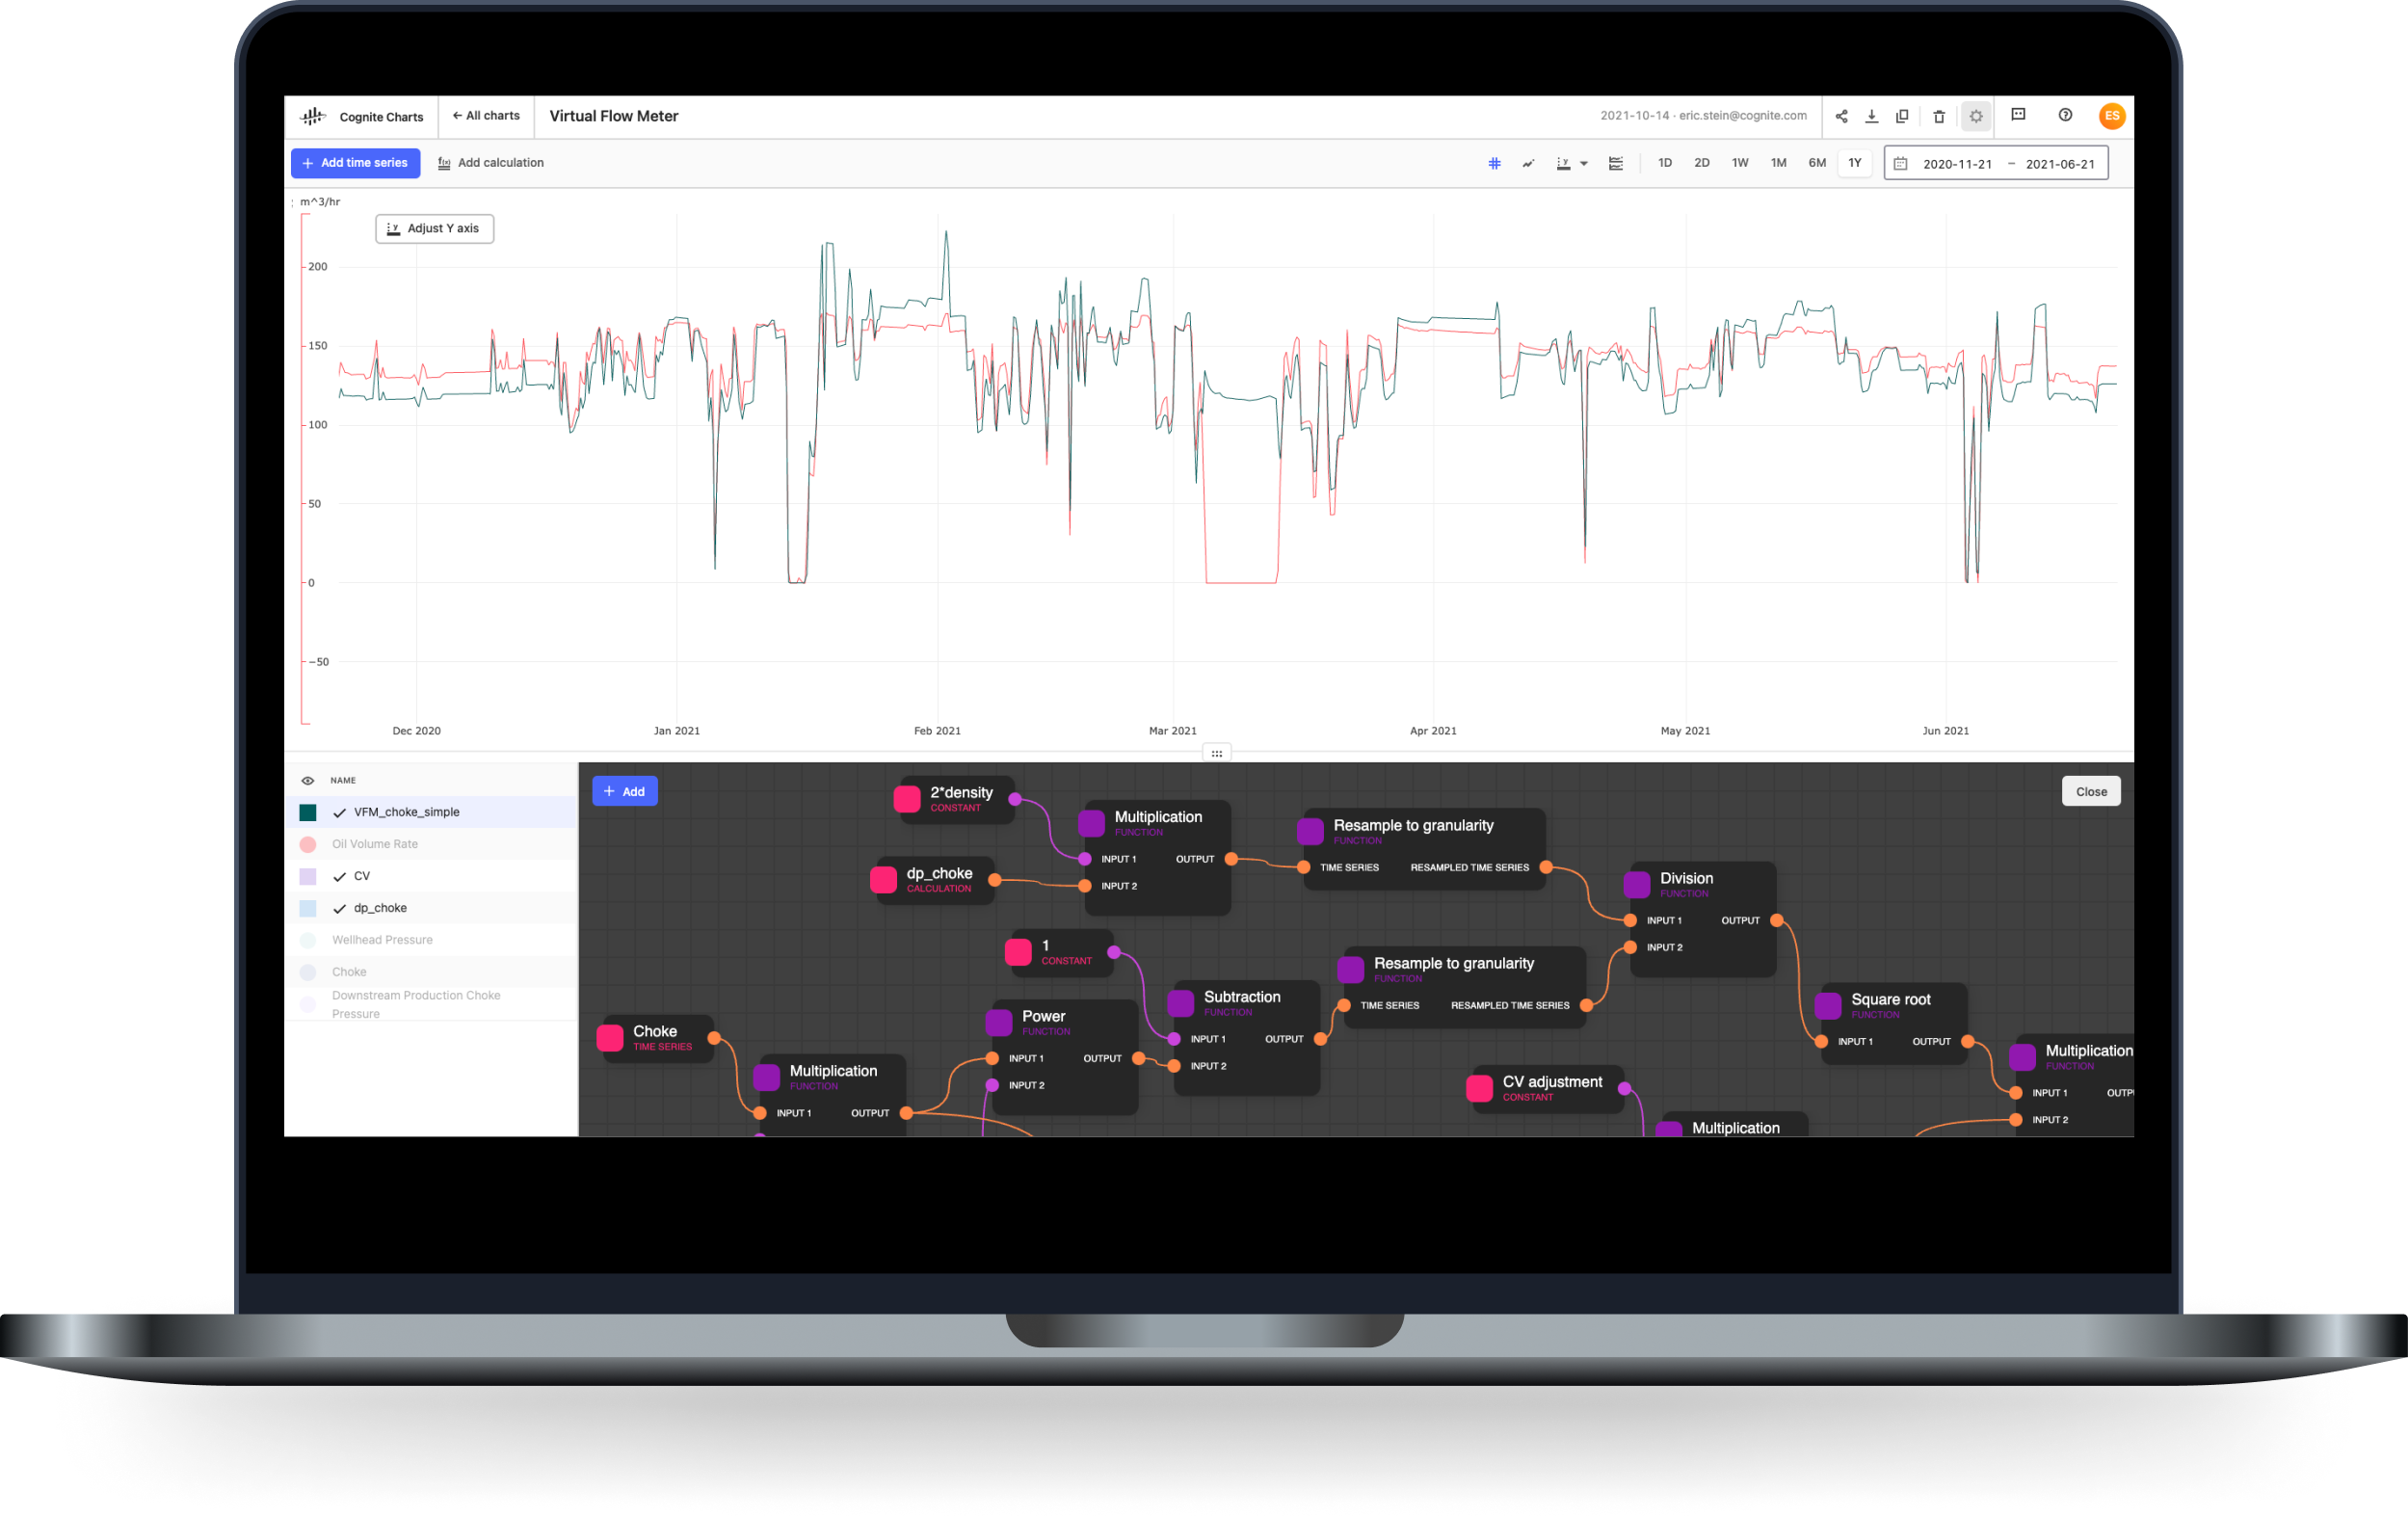
WHAT IS CHARTS?
Charts is a powerful tool for engineers and domain experts to explore, trend, and perform industrial time series analytics. It offers easy access to contextualized CDF data and no-code tools to find, understand, and work with data to gain actionable insights.
Everyone can access data for effective analysis with minimal setup. CDF provides a way to gather and contextualize all data in one location and Charts provide a visual window into these contextualized data for domain expert engineers.
A no-code calculations interface empowers anyone to build complex calculations and data science solutions that can be used to make informed, correct decisions. A continuously expanding data science feature store with functions and algorithms that are ready out-of-the-box.
Enter your E-mail address. We'll send you an e-mail with instructions to reset your password.