

 Check the
documentation
Check the
documentation Ask the
Community
Ask the
Community Take a look
at
Academy
Take a look
at
Academy Cognite
Status
Page
Cognite
Status
Page Contact
Cognite Support
Contact
Cognite Support

Hi everyone,
I have a question: Can we use data from Data Models in Canvas?
Is there any way to visualize that data available in Data models into Canvas?
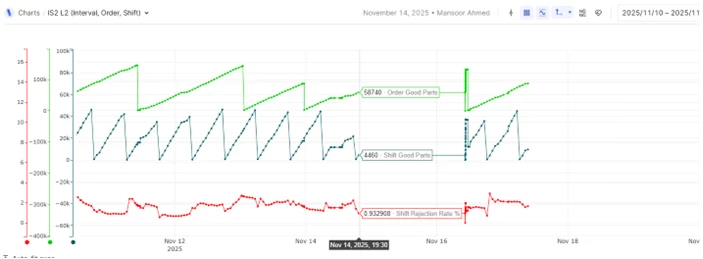
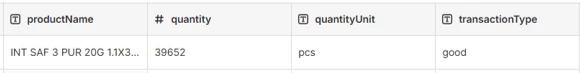
In our case, we are using Cognite Charts with time series data coming directly from machines (e.g., good parts, bad parts). However, the time series does not include product or batch information, which we do have in our Data Model.
Is there any possibility to link both sets of information together for analysis?
My initial thought is: if I can bring the required data from Data Models into Canvas and then create charts there, it would make the analysis much easier.
But I’m not sure if this is possible—or if there’s another approach you would recommend.
Any suggestions or best practices would be greatly appreciated!
