Johannes
Committed ⭐️⭐️
Committed ⭐️⭐️
April 4, 2023
Solved

Domain Expert Fundamentals - Charts - data mismatch in quiz?

  • April 4, 2023
  • 4 replies
  • 155 views

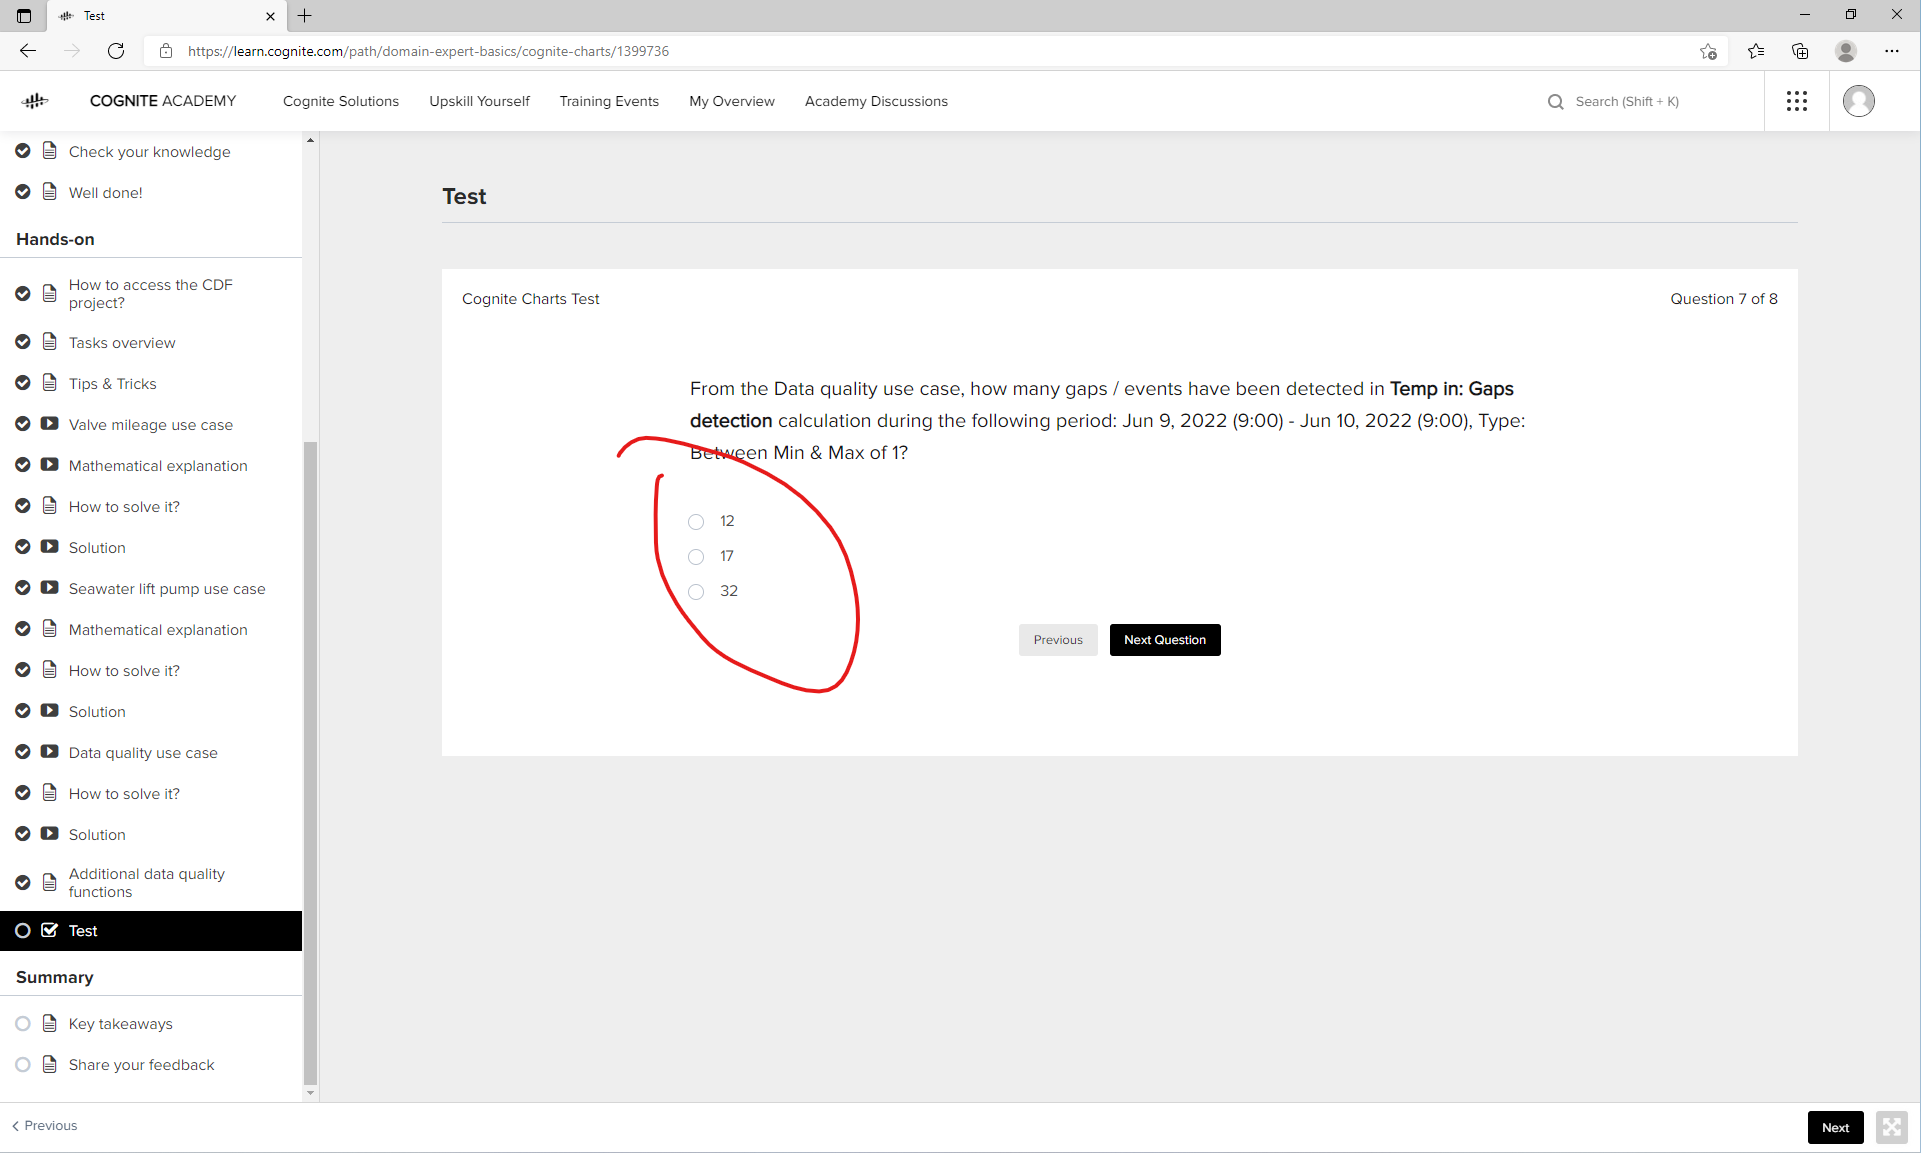
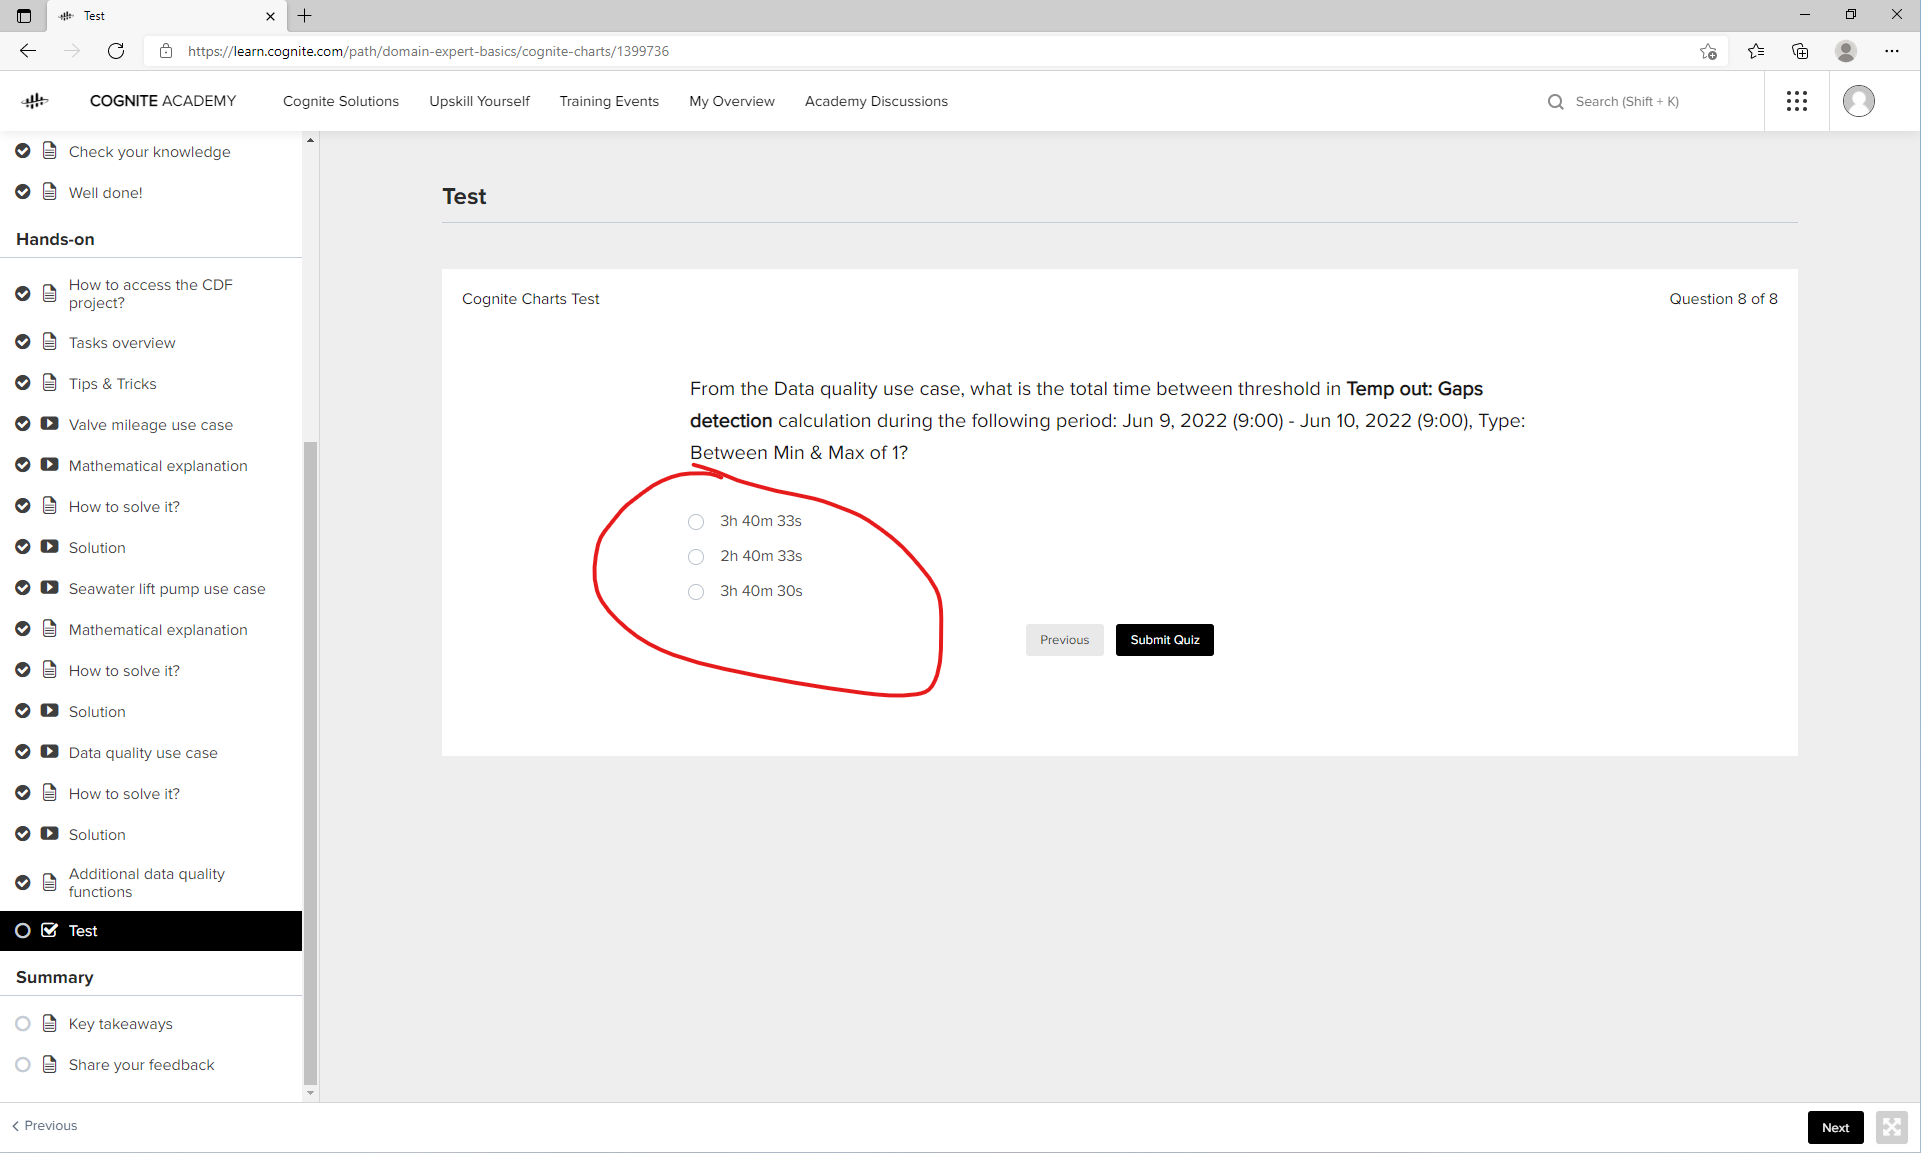
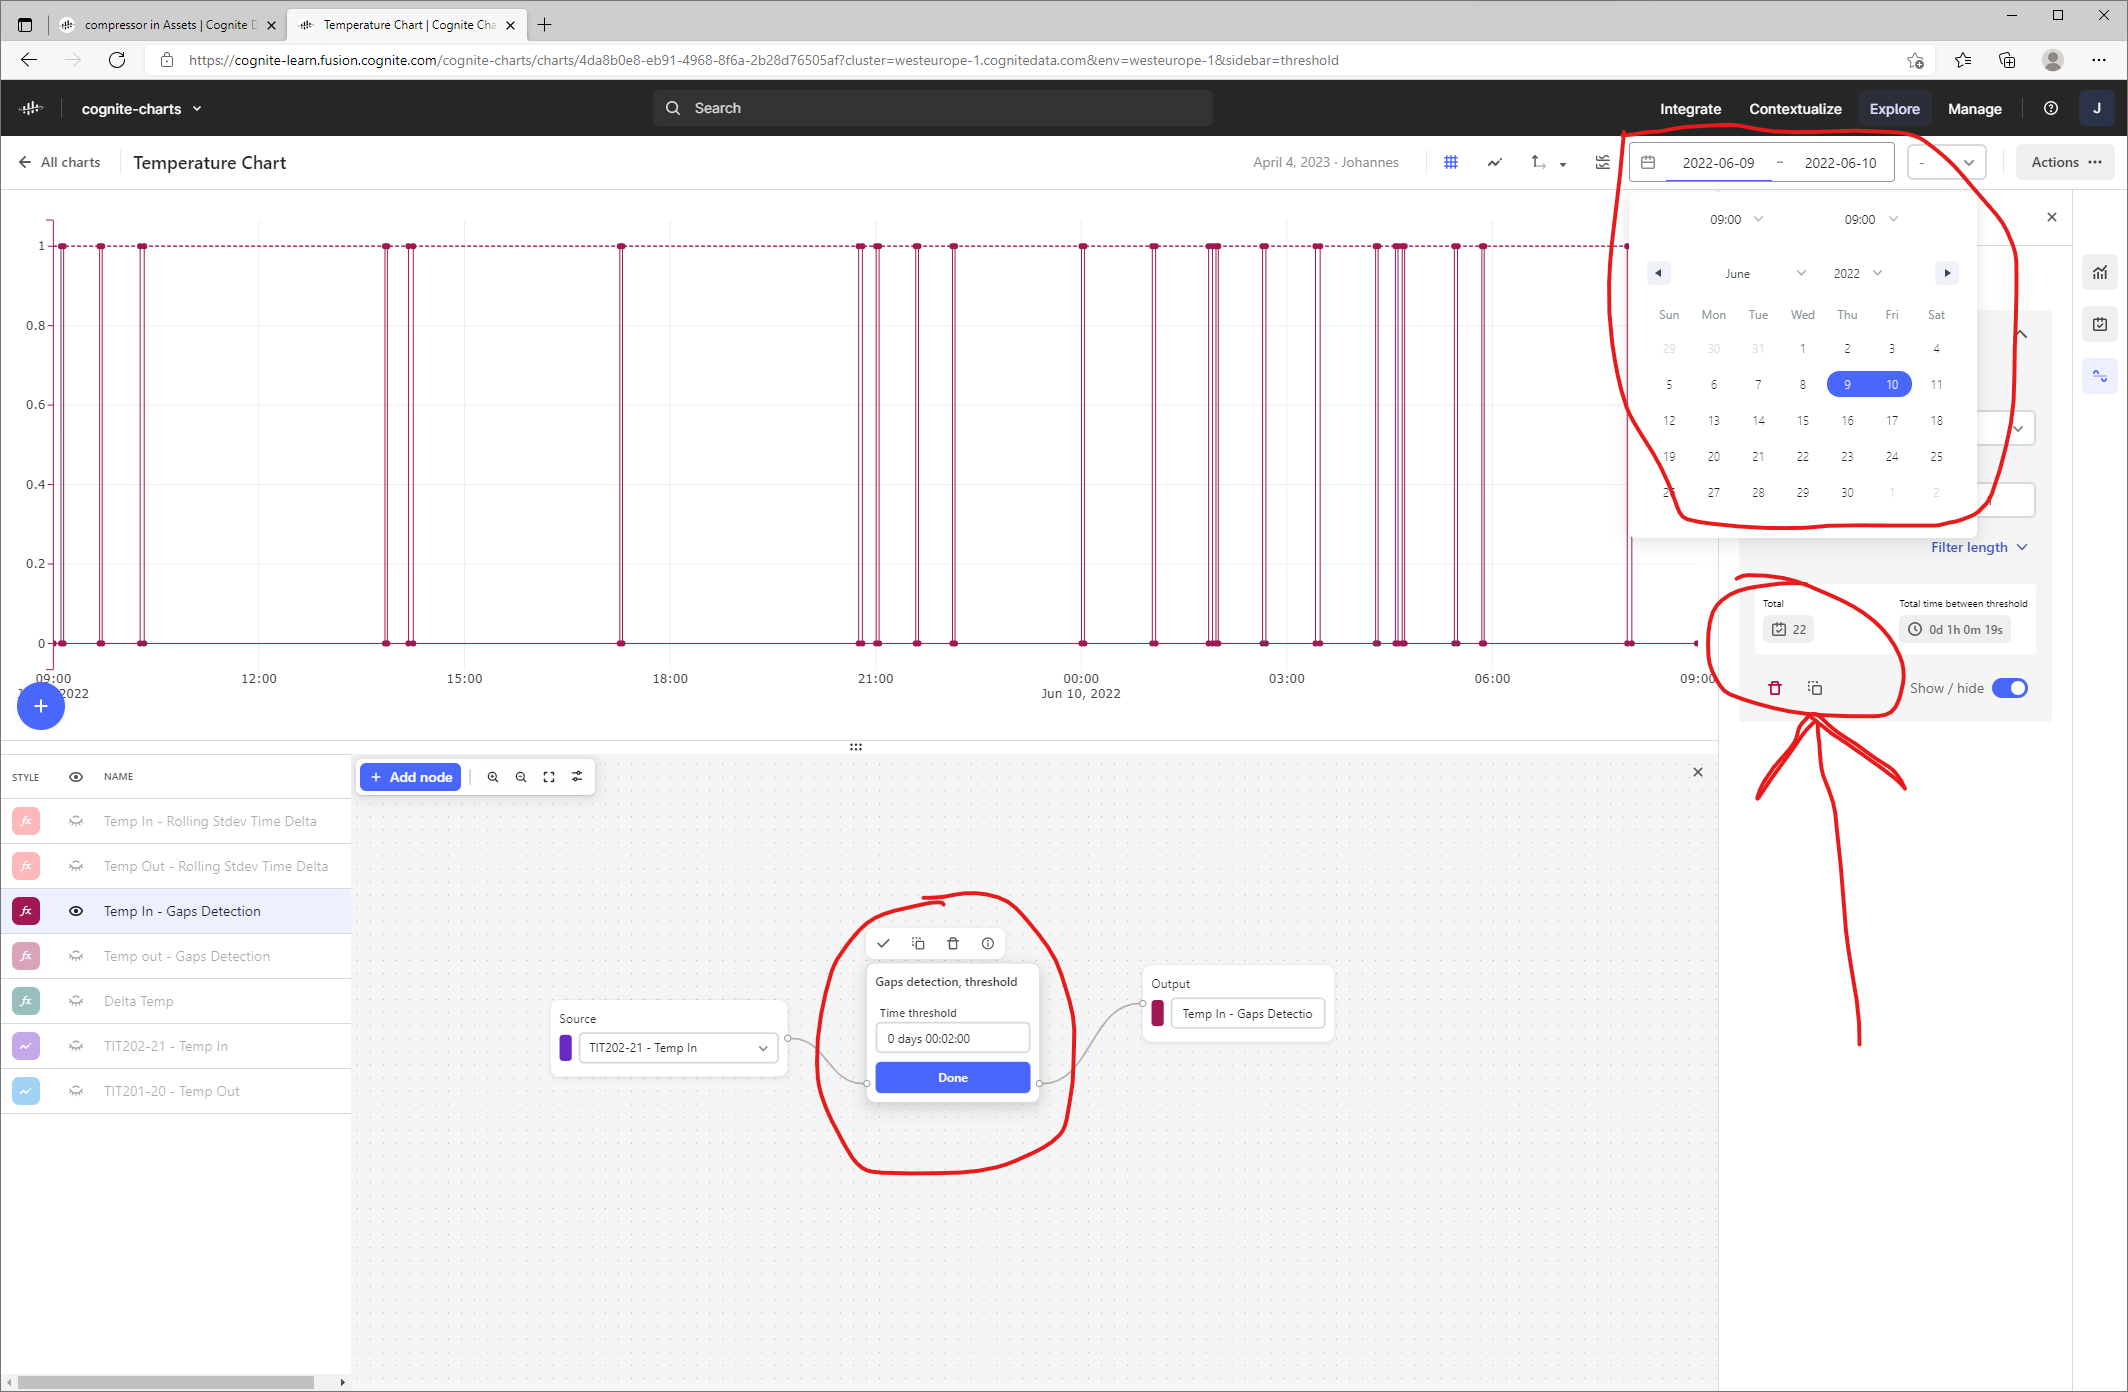
In the Charts chapter, question 7 and 8 in the quiz asks for some reference values that I cannot understand can be correct. The quiz asks for number of  threshold events and durations within a specific timeframe:
 

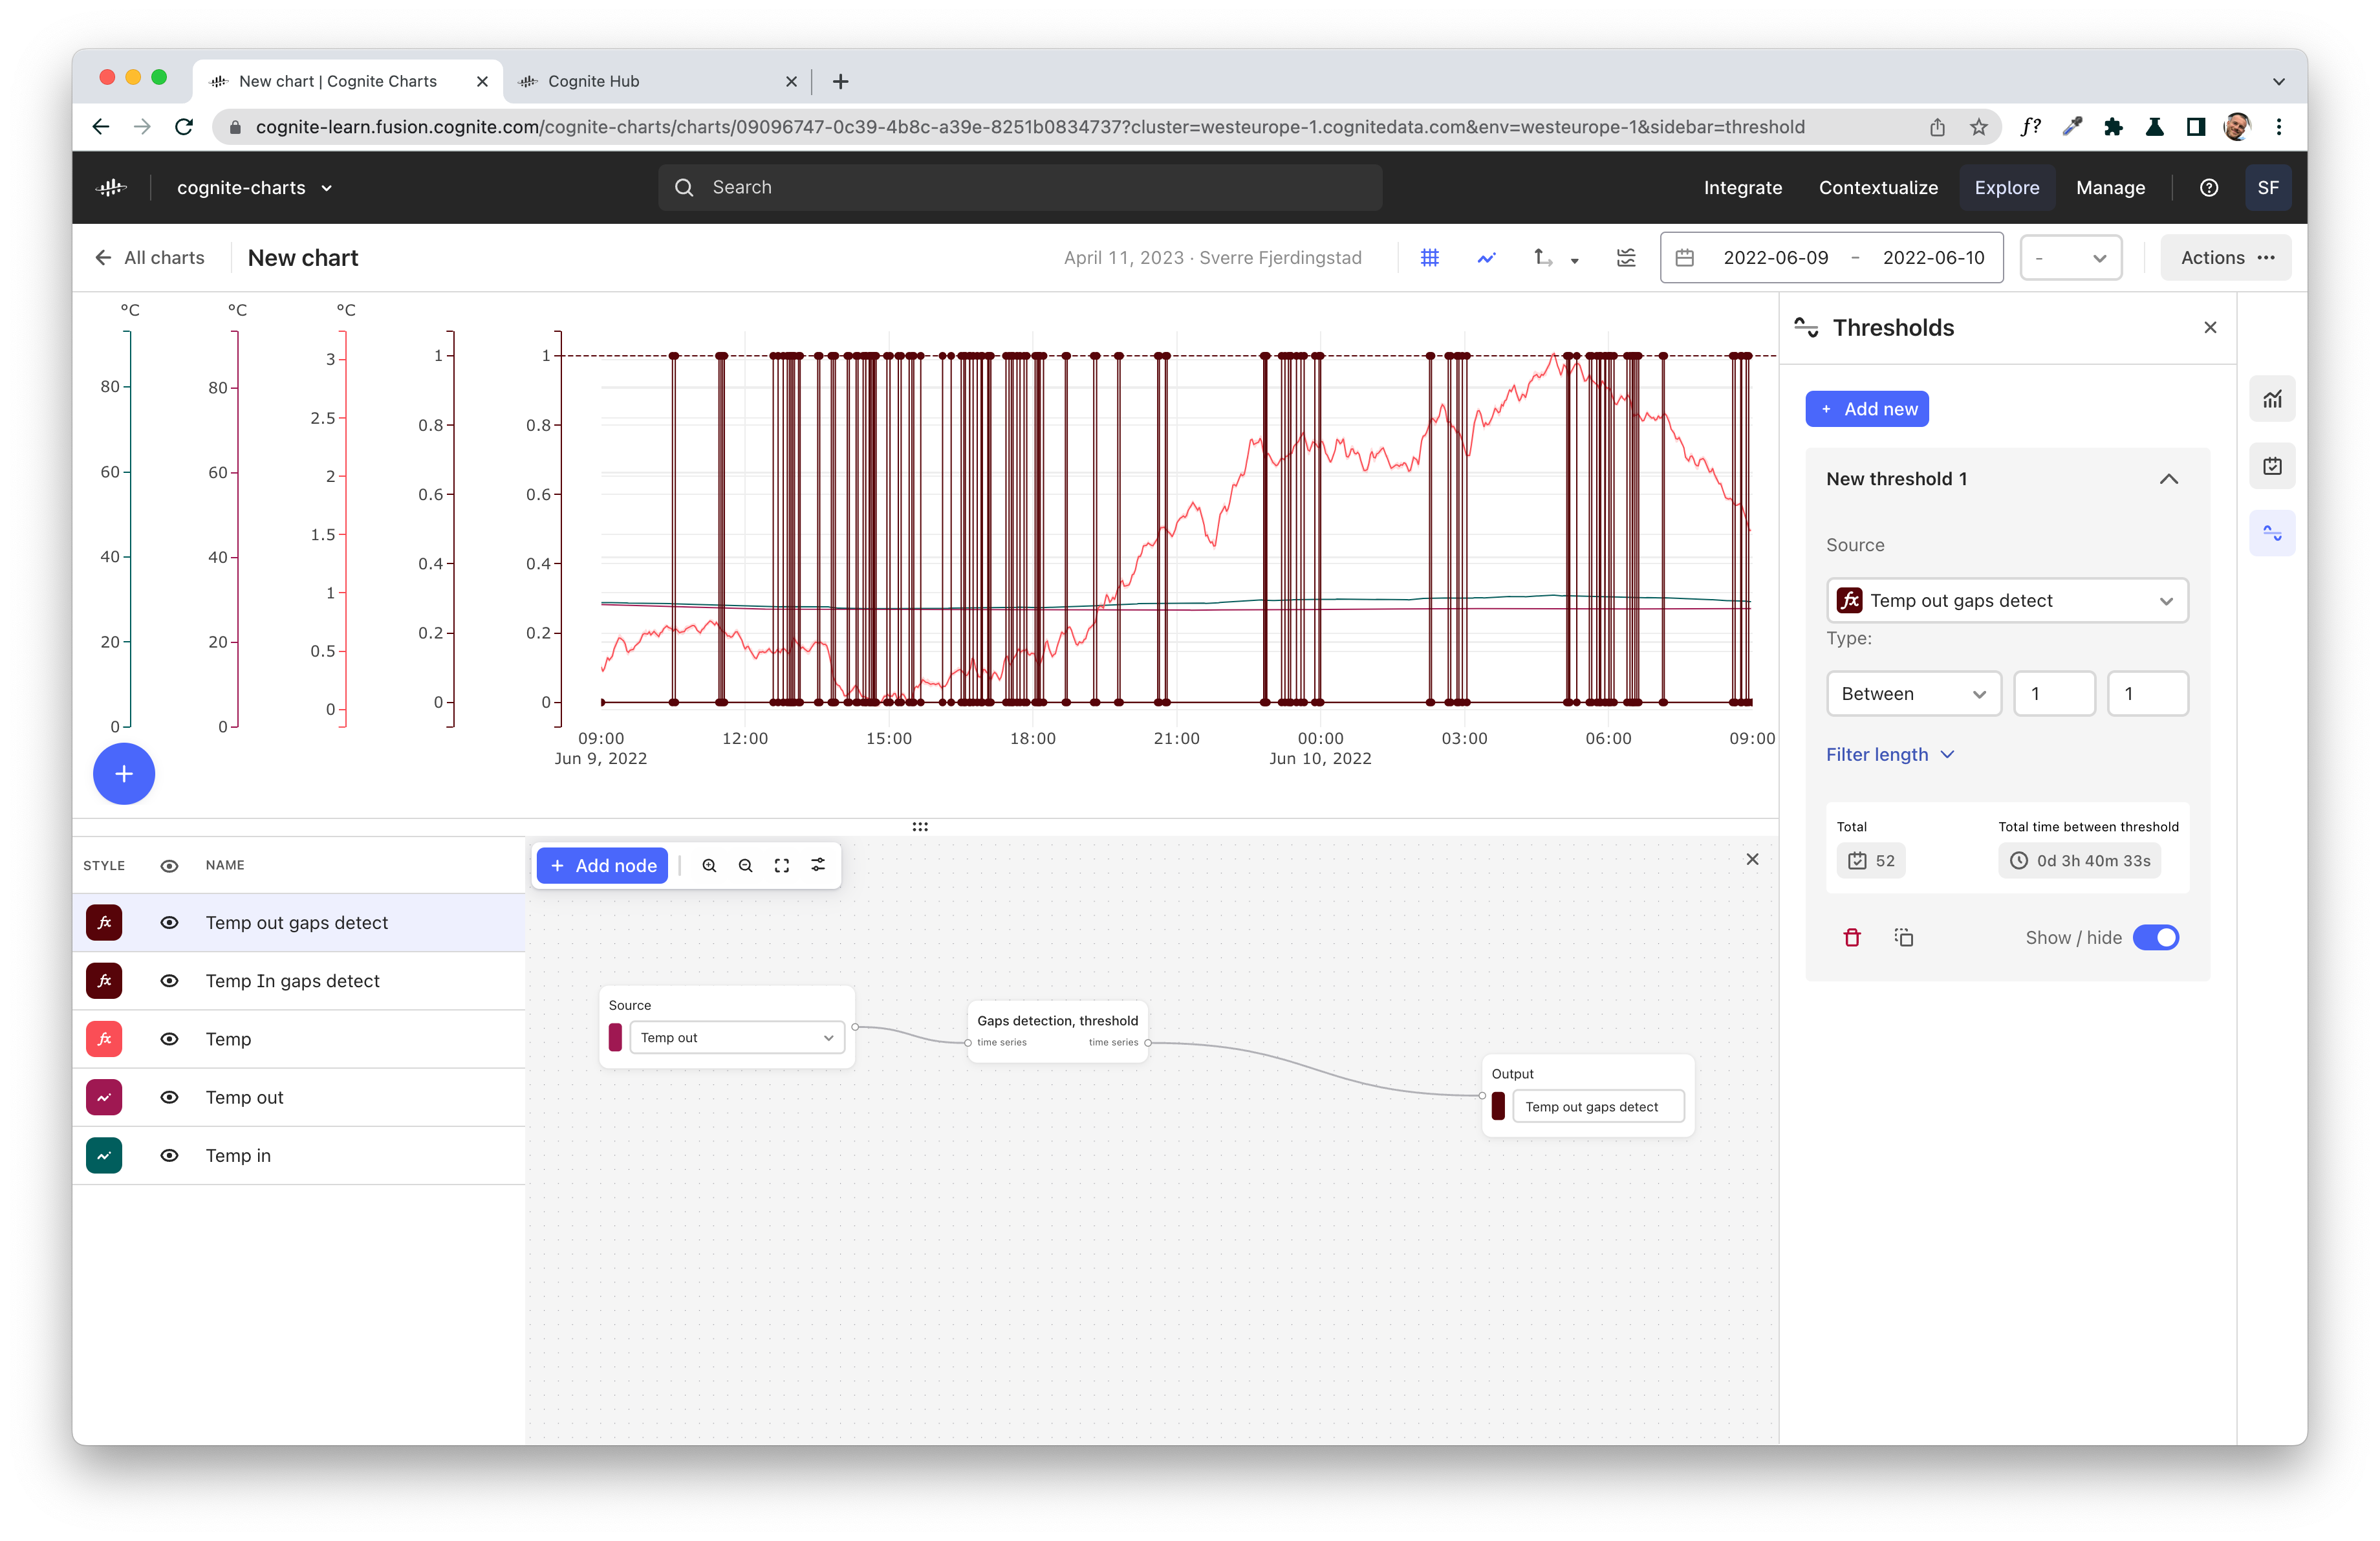
From the Data quality use case, how many gaps / events have been detected in Temp in: Gaps detection calculation during the following period: Jun 9, 2022 (9:00) - Jun 10, 2022 (9:00), Type: Between Min & Max of 1?


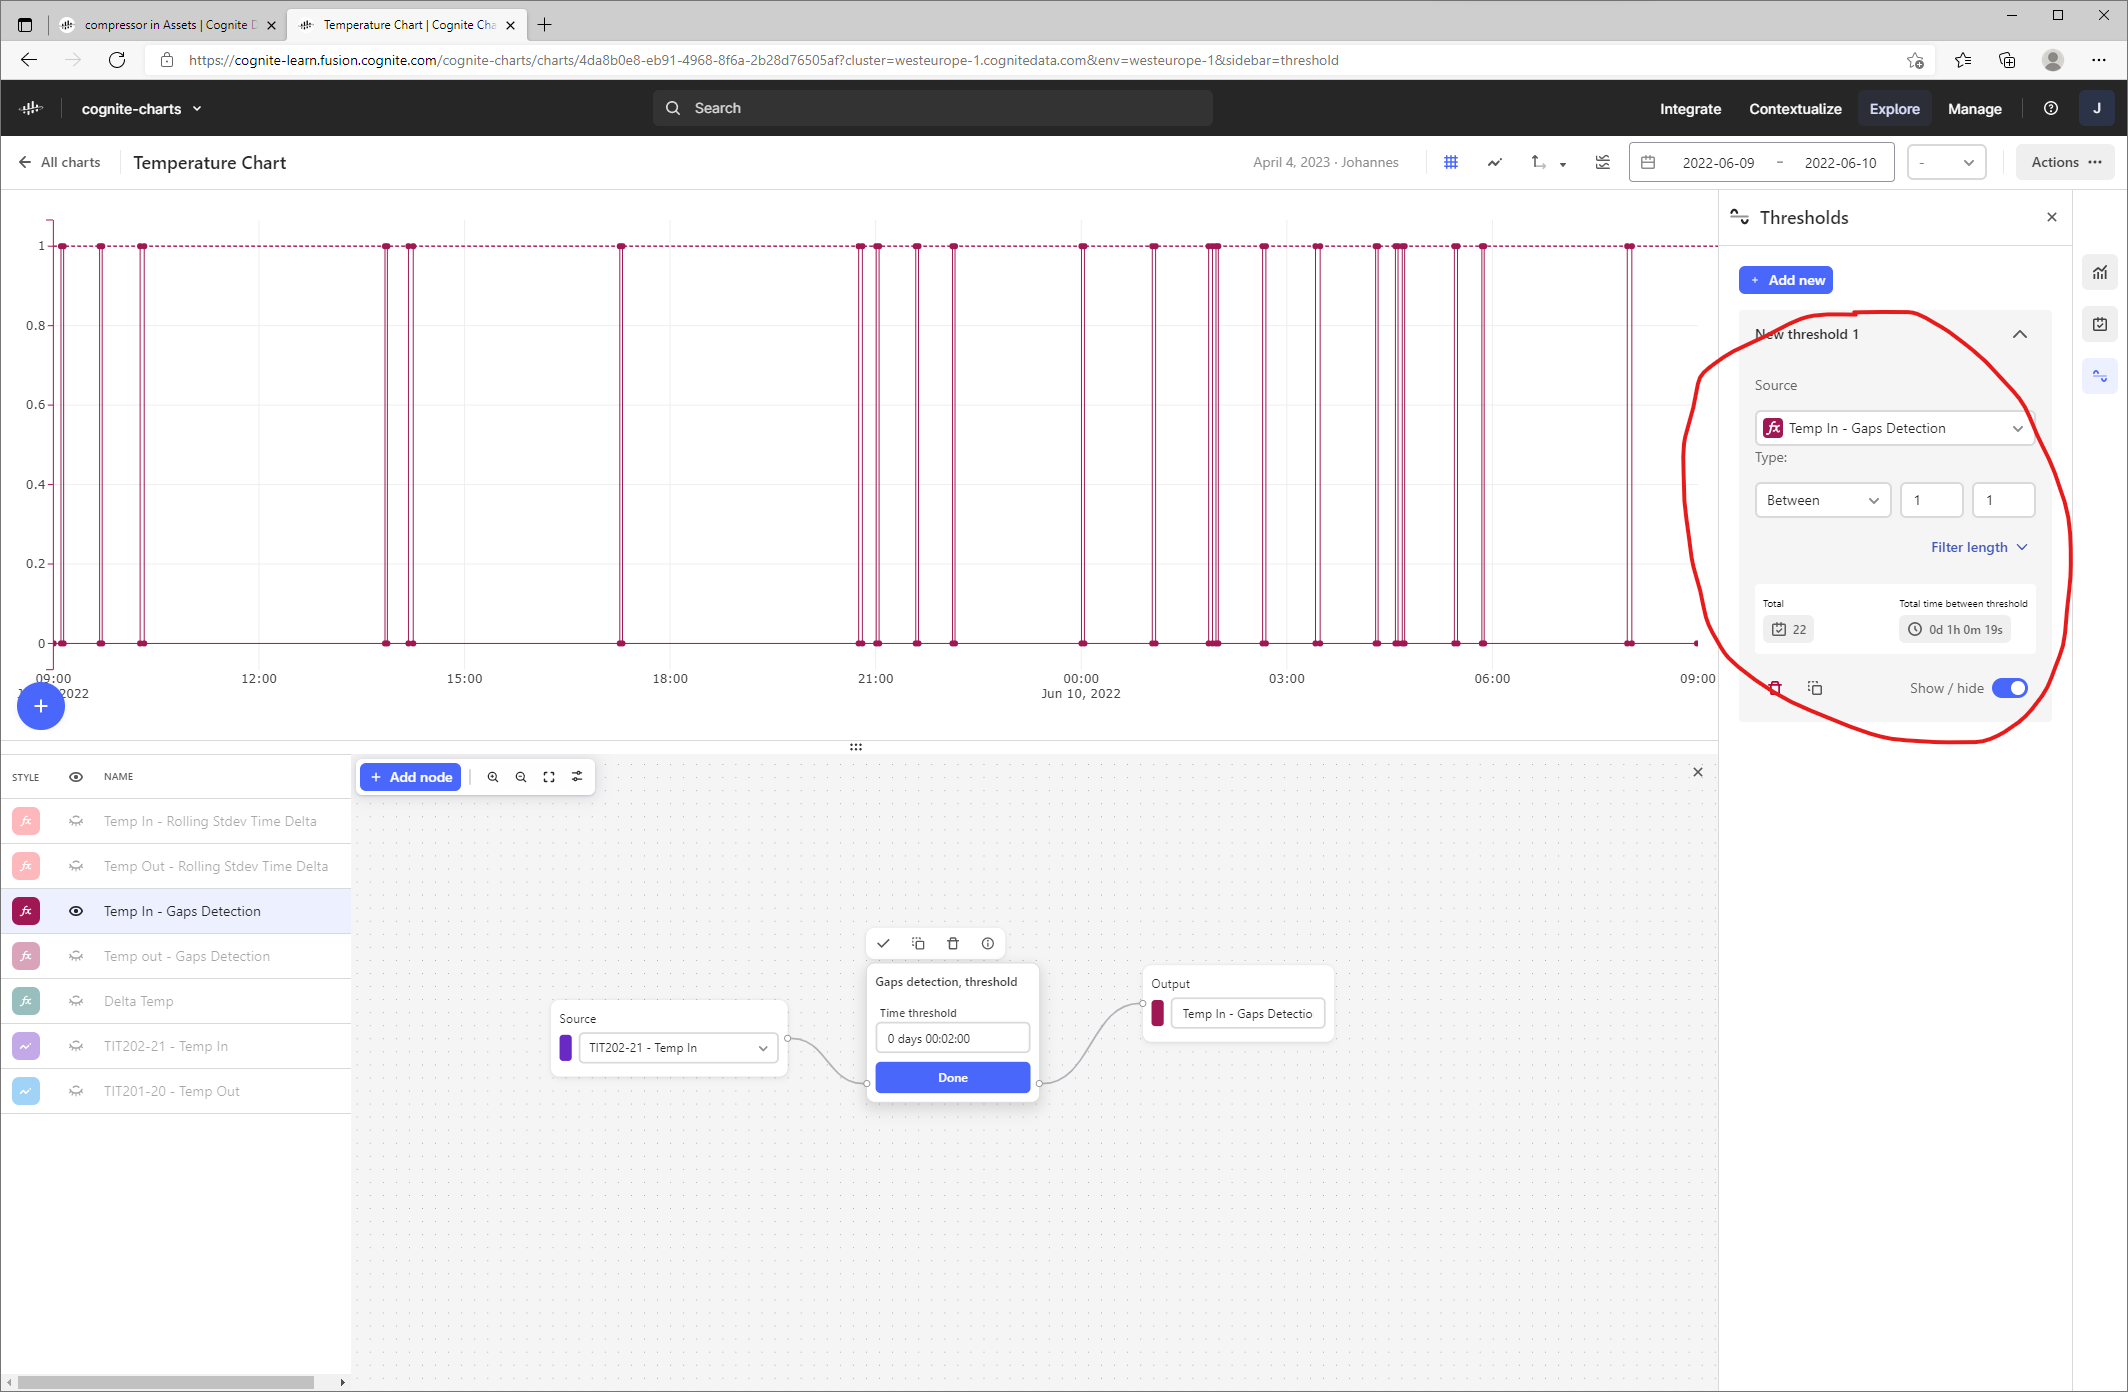
However, none of the alternatives match the resulting dataset I see in Charts.


I am a new learner, so perhaps a mistake somewhere, but I have checked multiple times and cannot see any error on my part. Is it only me? Or is there a mismatch in the data?


Kind regards
Johannes
 

    Best answer by Sverre Fjerdingstad

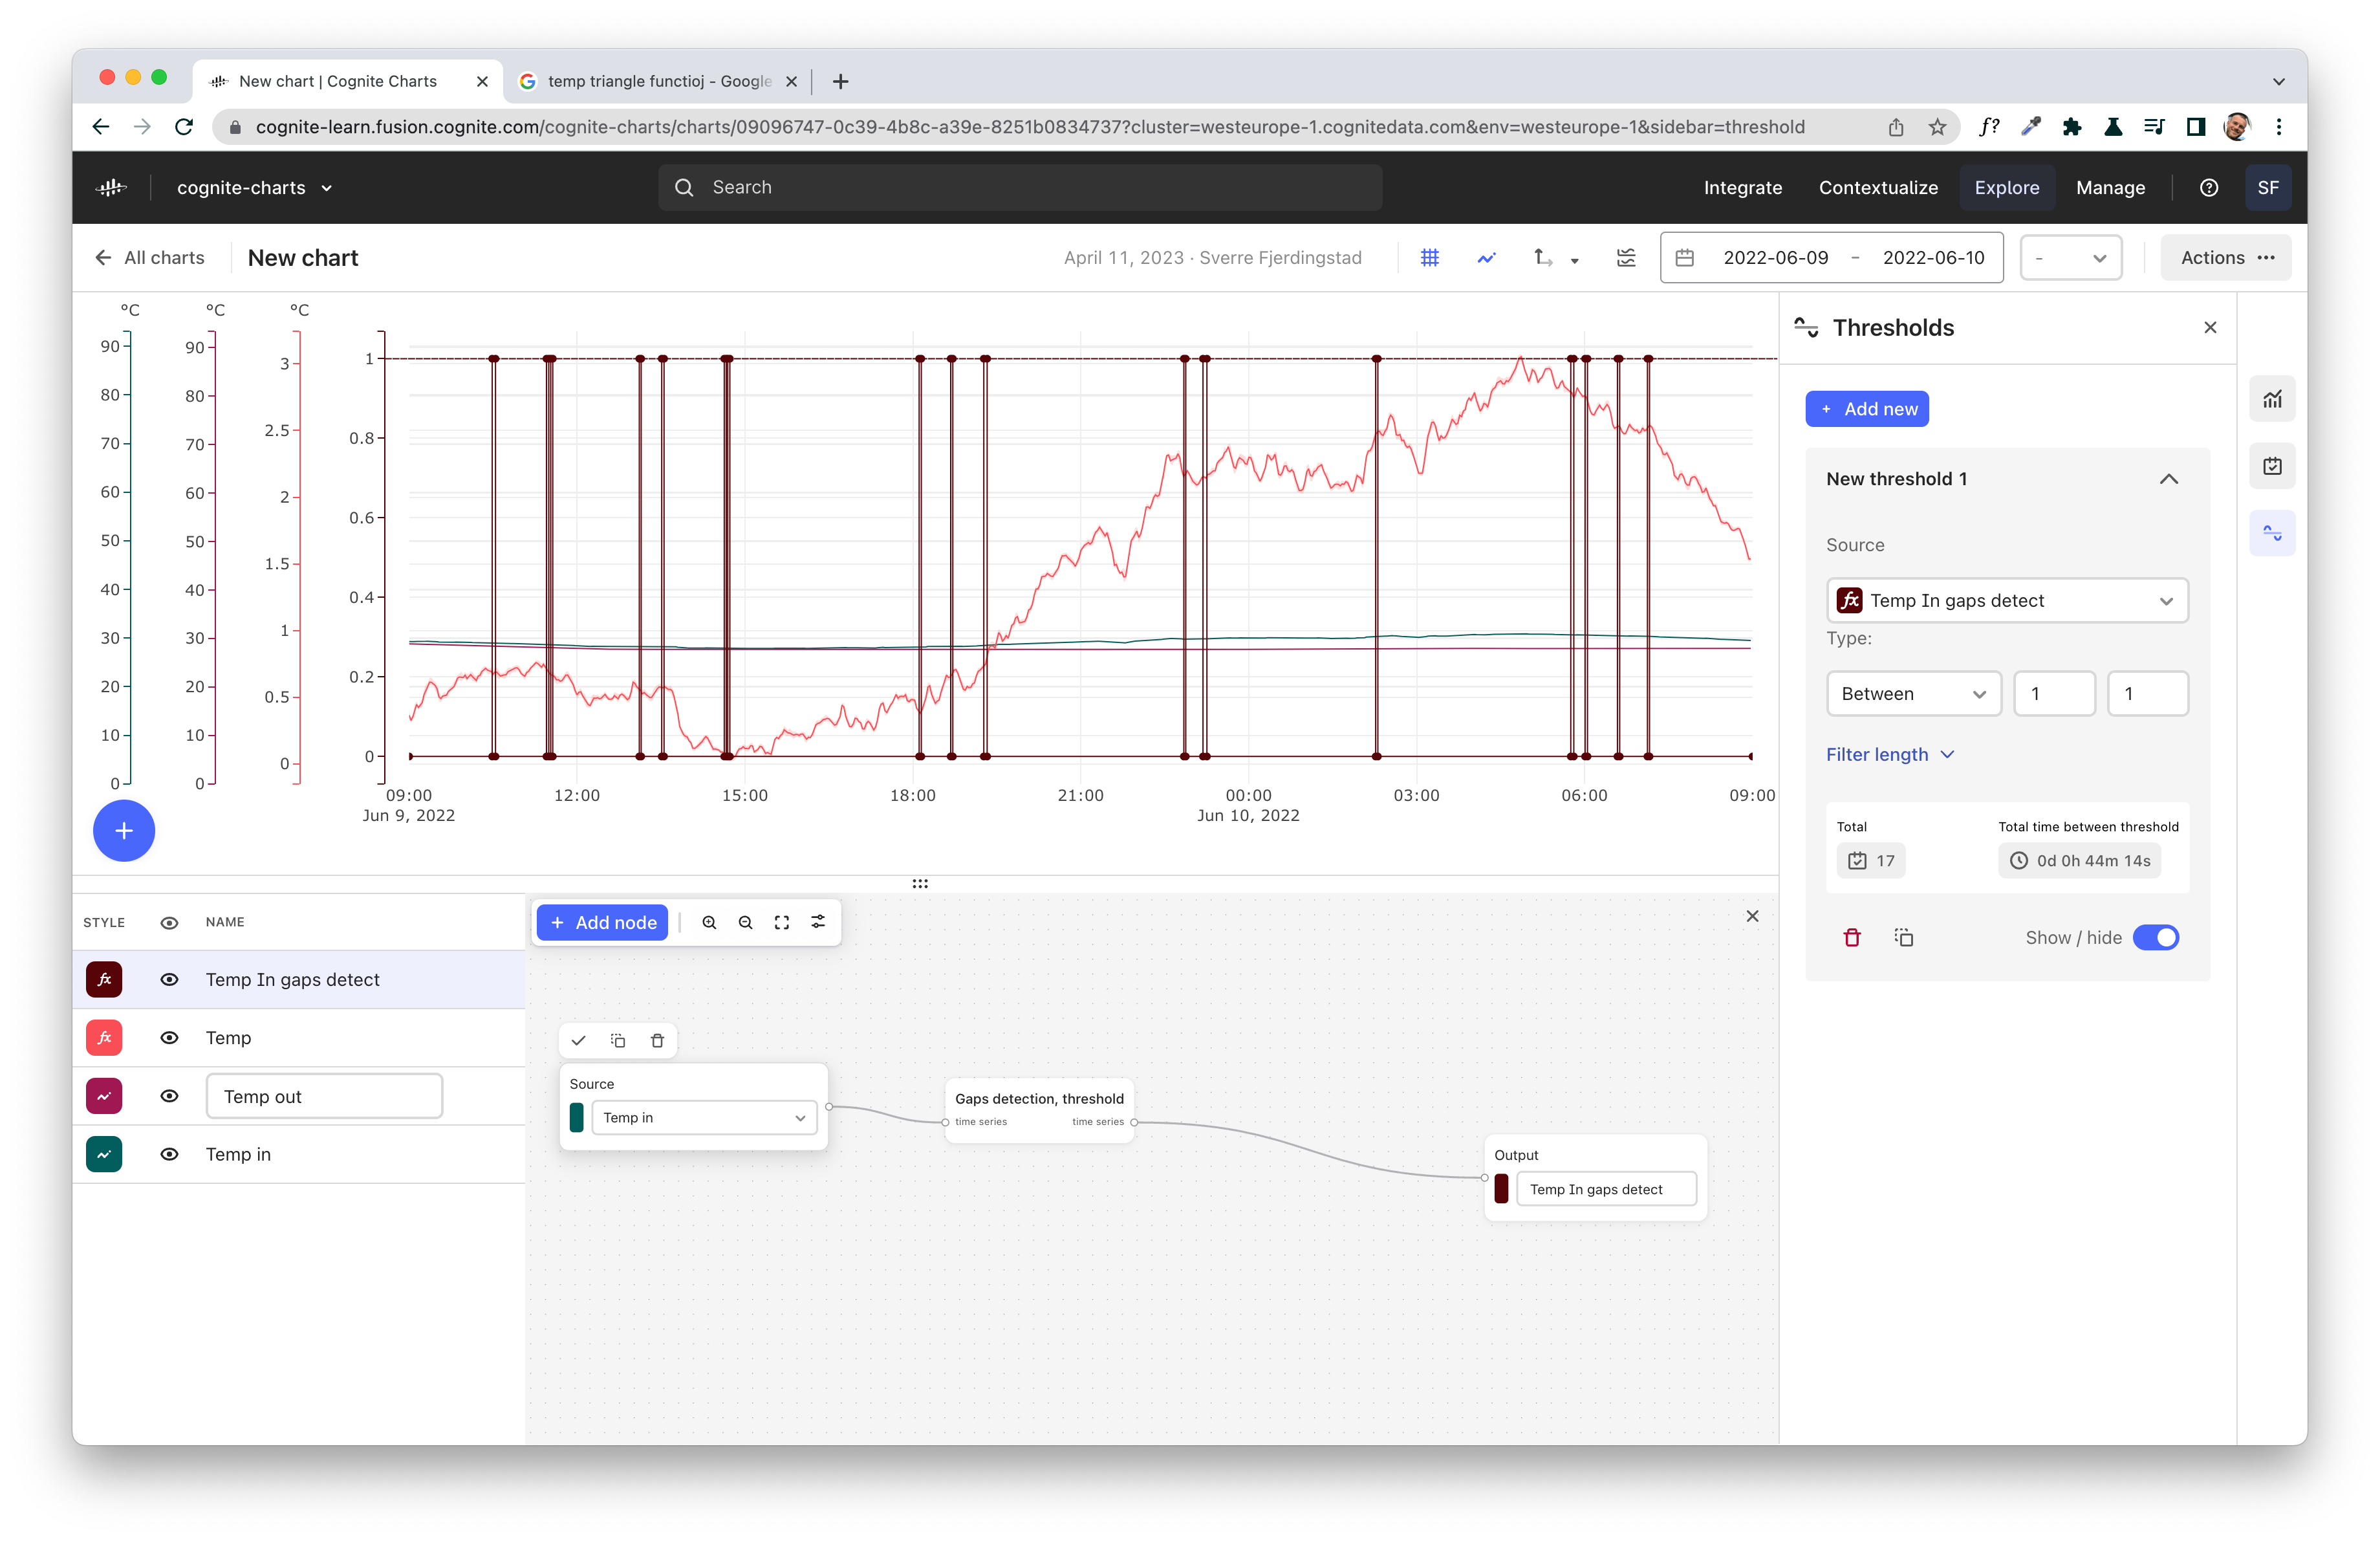
    Hey @Johannes! I tried this myself just now and got it right (at least something that are alternatives in the quiz🤐). At a glance It does look like you’ve done correct steps... Sometimes you need to refresh/add and remove the threshold filter for it to show the correct values. Either it’s as simple as that or you might wanna try recreating the steps from the Solution video once more.


    4 replies

    Sofie Haug
    Expert ⭐️⭐️⭐️⭐️
    Cognite Academy Instructor
    April 5, 2023

    Thank you so much for your feedback! I’ll have to set a side some time to investigate this! I’ll get back to you right after Easter!

    Sofie, Cognite Academy

    Sofie | Cognite Academy
    Sverre Fjerdingstad
    Practitioner ⭐️⭐️⭐️
    Cognite Academy Instructor
    April 11, 2023

    Hey @Johannes! I tried this myself just now and got it right (at least something that are alternatives in the quiz🤐). At a glance It does look like you’ve done correct steps... Sometimes you need to refresh/add and remove the threshold filter for it to show the correct values. Either it’s as simple as that or you might wanna try recreating the steps from the Solution video once more.


    Sverre | Cognite Academy
    Johannes
    Committed ⭐️⭐️
    JohannesAuthor
    Committed ⭐️⭐️
    April 11, 2023

    Hm, must have been a caching issue or something. I opened the same chart on a brand new computer today, and now I see the same results as you. Didn't make any changes, so it must have been solved by the proper refresh.

    Thanks for confirming, appreciate the effort :)


    Committed ⭐️⭐️
    May 12, 2026

    Hello! 

    Just bumping this thread up as I have found the same situation as Johannes described above (and the same results as described by him). 

    Other than refreshing the dataset is there any recommended steps for this situation? 

    Best,