Check the
documentation
Check the
documentation Ask the
Community
Ask the
Community Take a look
at
Academy
Take a look
at
Academy Cognite
Status
Page
Cognite
Status
Page Contact
Cognite Support
Contact
Cognite Support

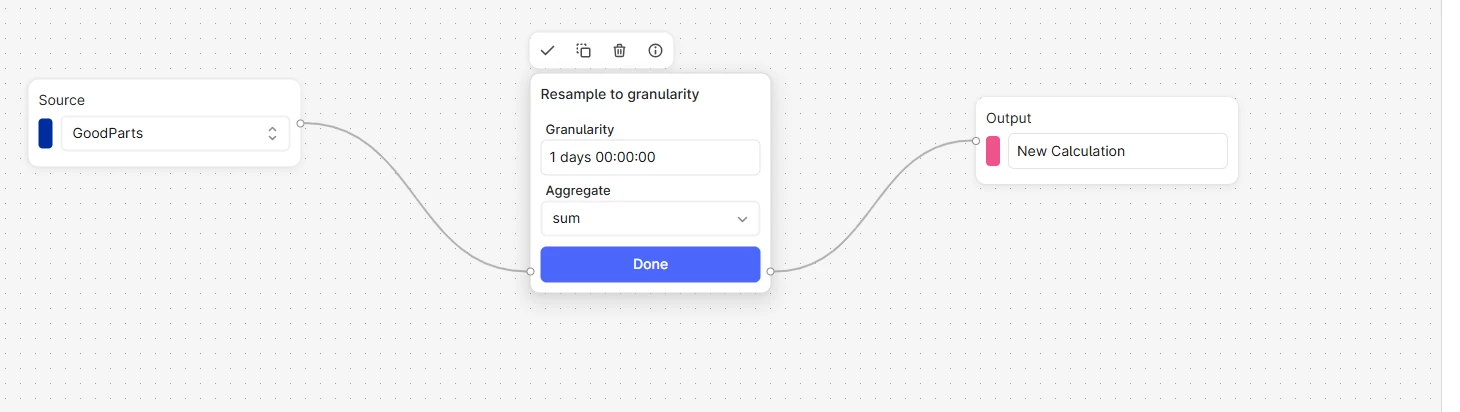
Hi Everyone,
I’m trying to sum up all the values in my data points for a daily total. However, the Resample to Granularity function doesn’t seem to work properly on my side. Also, I noticed that we can’t select a custom time frame in this function — for example, if I want to sum values between specific hours, that option isn’t available.
Is there any other function that allows summing all data points within a specific time range?
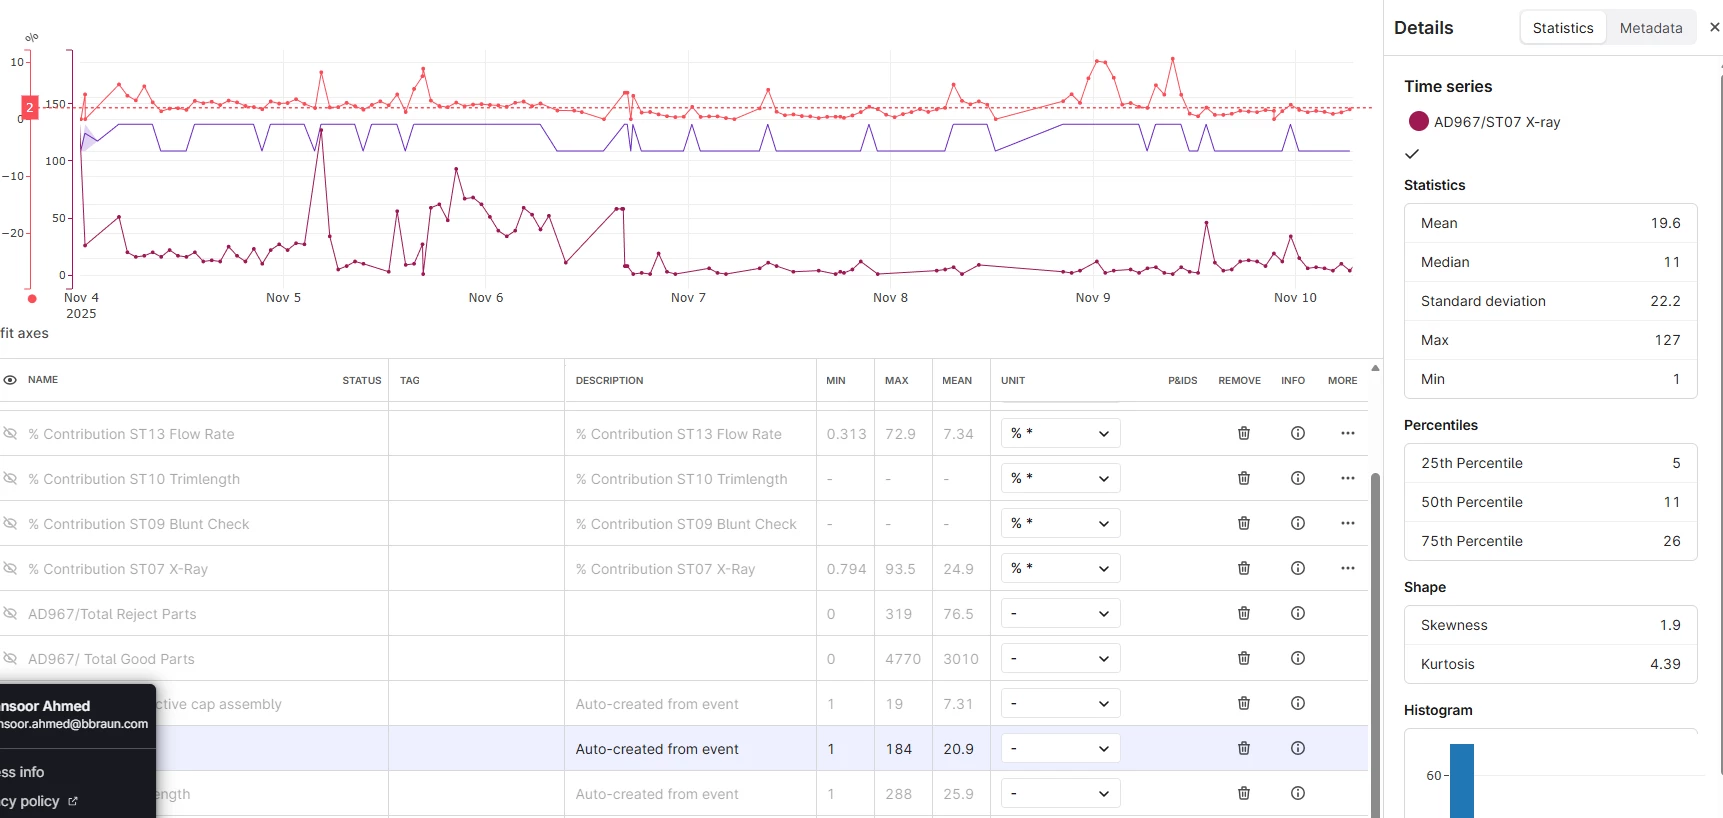
One more thing: I find the Statistics window for each time period very useful. Wouldn’t it be great if we could also have a Sum value displayed there?