Check the
documentation
Check the
documentation Ask the
Community
Ask the
Community Take a look
at
Academy
Take a look
at
Academy Cognite
Status
Page
Cognite
Status
Page Contact
Cognite Support
Contact
Cognite Support


Team, can someone help with this ?
Customer Context:
“We implemented Datamosaix primarily to collect compliance related data for our facilities and to give access to those personnel to pull data.
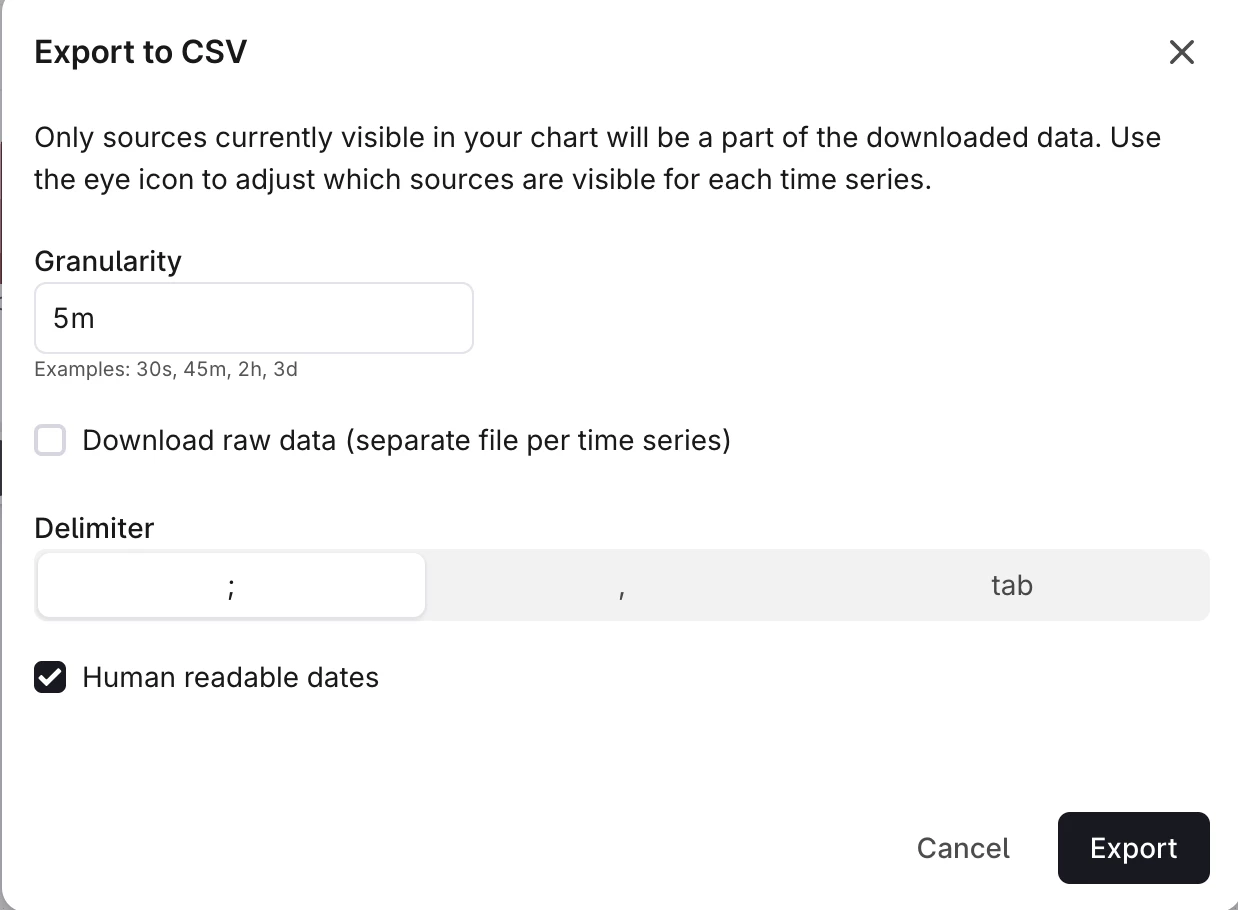
It varies on which reporting agency this is for but they typically produce reports in csv format that is for one month at a time, on a strict 5min or 1min interval starting at midnight on the first day of the month.
We've been using the PI trend tool previously and would like to produce reports in a similar way.”
******************************************************************************
Customer End to End Flow:
-This data is coming from FT Historian, which is collected on deviation not time.
-The purpose of DataMosaix in our use case is to give access to Compliance personal to pull data.
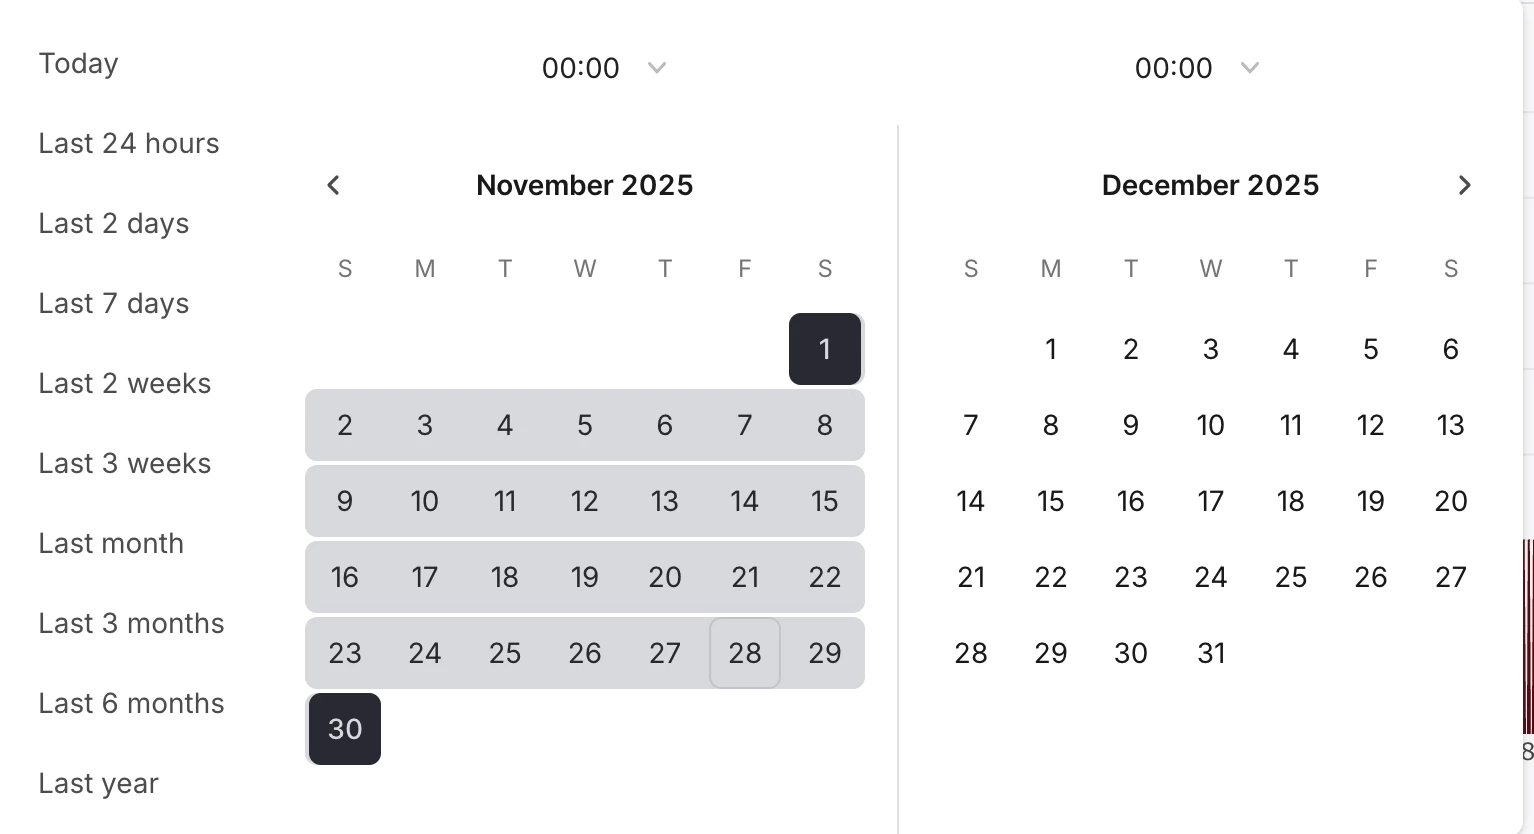
-They need data produced at specific time intervals. One example may be every 5 minutes for an entire month for 20 different tags per site. This needs to start at midnight and end at midnight on the first day of the following month. IE a data points at
00:00, 00:05, 00:10 etc.
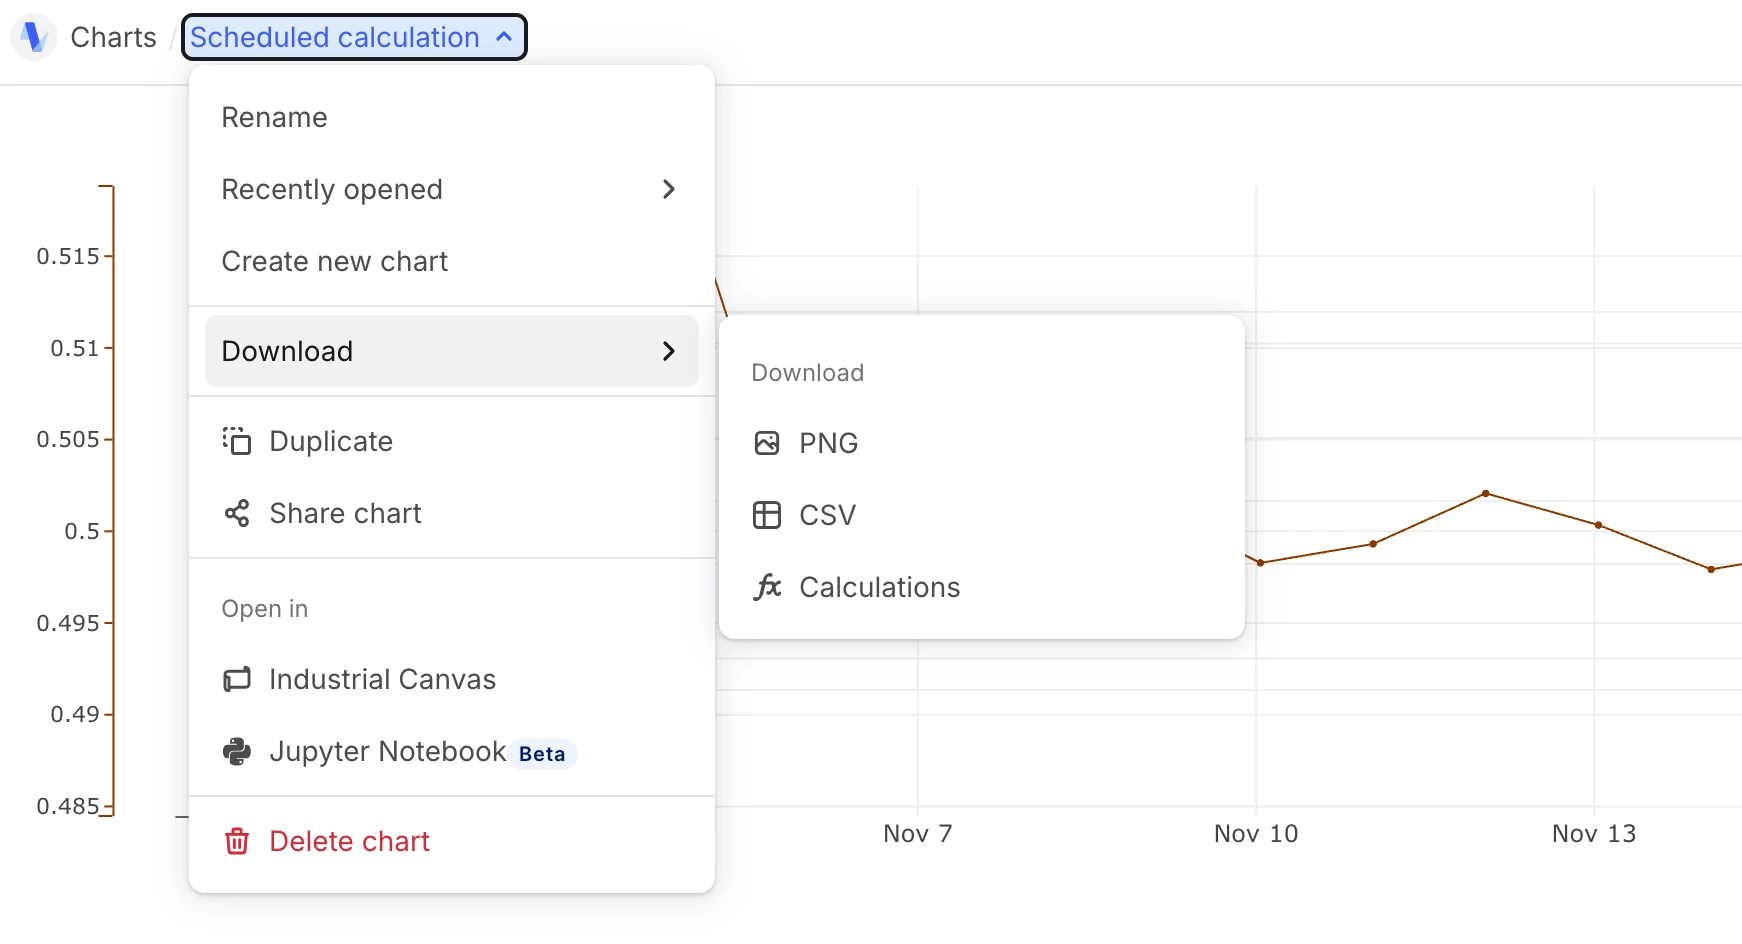
-It seems the only way to produce this is with granularity/interpolation functions in charts and to set the time period exactly for the month (I hope there is a better method as this is pretty clunky). Charts isn't able to display a whole month for even one tag and it doesn't have an export function that I can find.
-We're used to using the TrendPro/OSI PI trend viewer in FTView SE, this is accomplished very quickly with database sampling settings and exporting of the data. I typically setup the templates and the compliance folks and operators can just change time period to do this on their own for the monthly reports.