I understand.
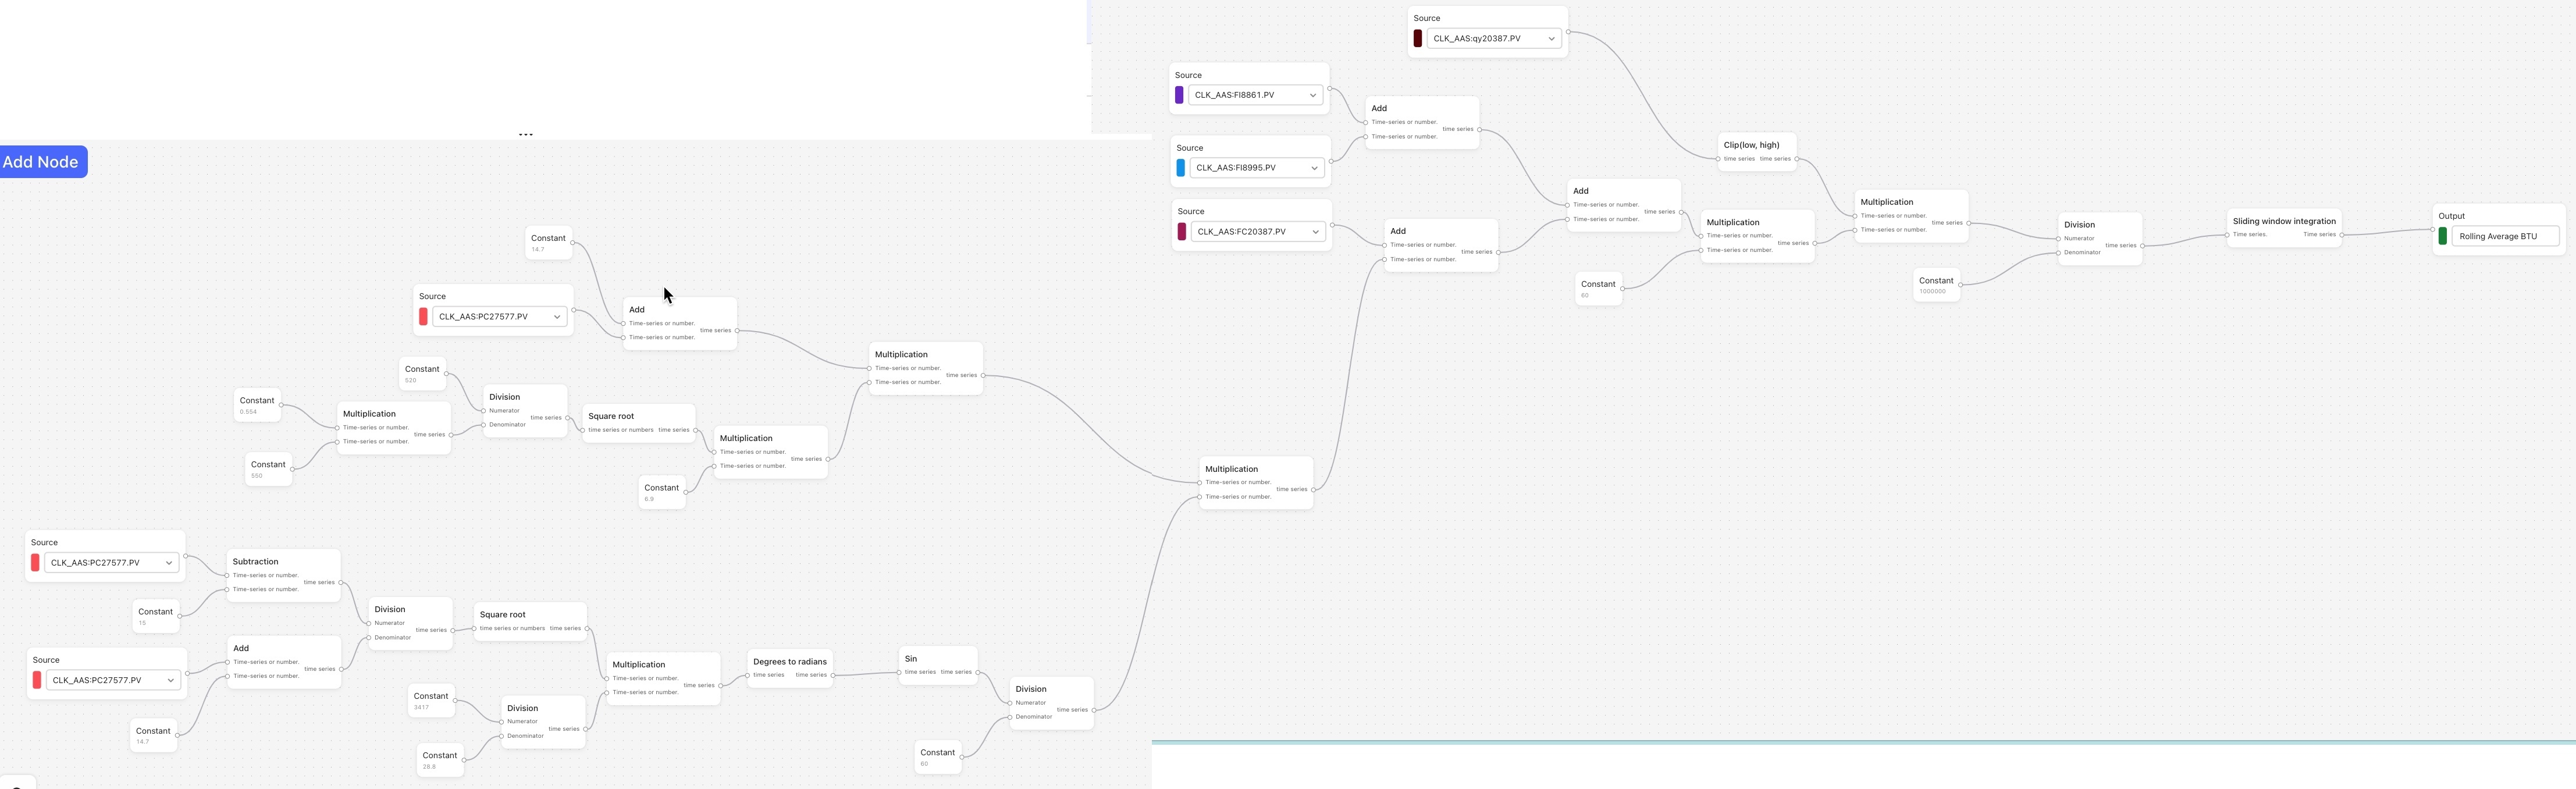
Keep also in mind that the moving average function (as it is implemented today) computes the pointwise average in each window, e.g.
(sum_x f(x)) / N,
where N is the number of data points x with values f(x) in the window - and not the integral average, i.e.
(integral t0..t1 f(x)) / (t1 - t0),
where t0 and t1 are the start and endtime of the window.
Is it the pointwise average that you are looking for?
Regarding your question on automatic resampling: with automatic resampling, data points of two or more time series are automatically aligned to a common timestamps if needed (by interpolation). The simplest example is adding two time series with non-matching timestamps. Without automatic reindexing the sum output will be empty (because none of the timestamps match), while with automatic reindexing, the sum output will have a value at the timestamps of both inputs.
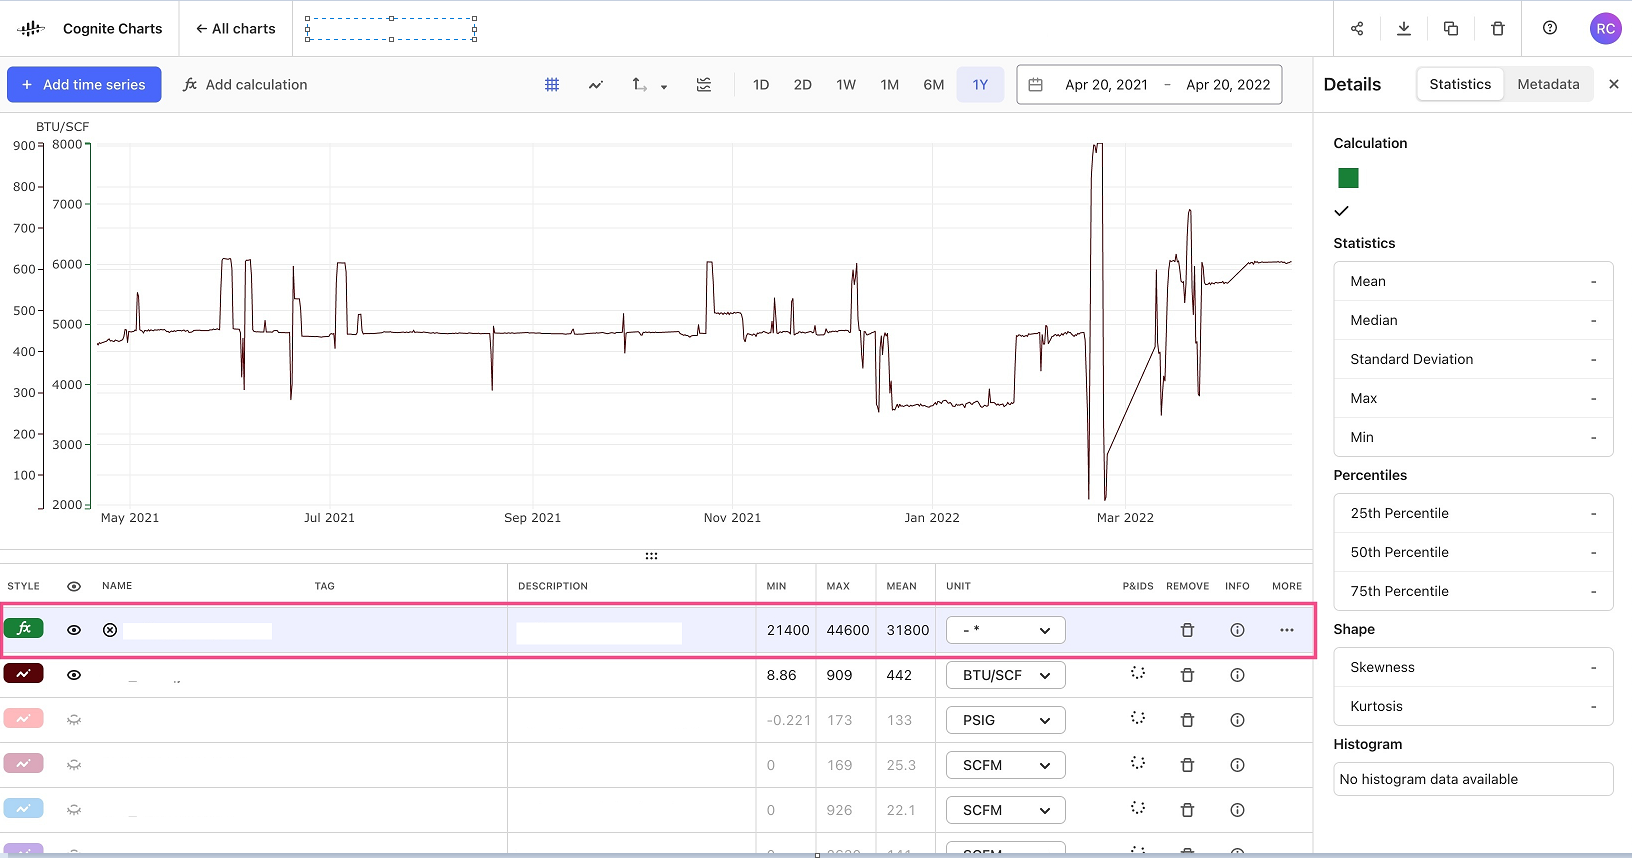
Finally: I am working on reducing the amount of downsampling that we do by a significant amount (hopefully 10x). We are currently testing the robustness of the solution, but if things go well we can roll this out in the next 1-2 weeks.


 Check the
documentation
Check the
documentation Ask the
Community
Ask the
Community Take a look
at
Academy
Take a look
at
Academy Cognite
Status
Page
Cognite
Status
Page Contact
Cognite Support
Contact
Cognite Support