Check the
documentation
Check the
documentation Ask the
Community
Ask the
Community Take a look
at
Academy
Take a look
at
Academy Cognite
Status
Page
Cognite
Status
Page Contact
Cognite Support
Contact
Cognite Support
I have a bit of a conundrum here. I am trying to visualize the daily and weekly averages of a time series in Azure Managed Grafana v11.6.3 using the CDF datasource. Raw data is strictly on hourly resolution, and provided in CET/CEST. Grafana is set to browser tz (i.e. CET/CEST). I need the daily average to align with CET midnight (=23:00 UTC).
I use these synthetic series parameters: aggregate='average', granularity='24h', alignment=82800000 (82800000 aligns the datapoints to the correct hour if I do aggregate='step_interpolation', granularity='1h').
The returned value is neither the UTC day average or the CET day average. It is exactly the average of the two. So from what I see it seems to be a 30-minute shift/interpolation in the backend.
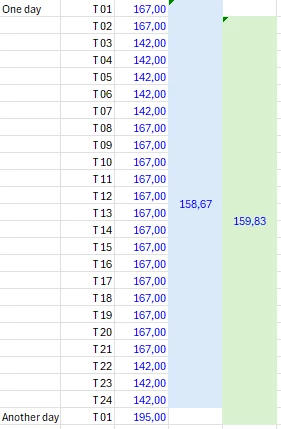
Case in point: CET day average for a specific day is 158,67, while its UTC equivalent is 159,83 (see screenshot). Neither value is found in Grafana for that day at 00:00 - here I see 159,25. Which coincidentally is equal to (158,67+159,83)/2.
The time range in the panel is from midnight to midnight, so there shouldn’t be any issue relating to a “now” time macro. I have tried a whole bunch of various alignments, but to no avail. Granularity=’1d’ was also not helping.
Is this a bug?
All the best
Tor