

 Check the
documentation
Check the
documentation Ask the
Community
Ask the
Community Take a look
at
Academy
Take a look
at
Academy Cognite
Status
Page
Cognite
Status
Page Contact
Cognite Support
Contact
Cognite Support

Hi everyone! 👋
The next Cognite Data Fusion product release is soon approaching. Together with the return of the sun (for those of us in the icy north), we are excited to announce several new upcoming features across our most popular user interfaces and DataOps capabilities.
This post will walk you through selected highlights from the release:
- Increase efficiency of troubleshooting and root cause analysis with updates to Industrial Canvas
- Improve productivity in Jupyter Notebooks with enhanced AI co-pilot and collaboration
- Accelerate solution development with new Unit Conversion and Time Series enhancements
- Increase robustness of data pipelines with Data Workflows
- Improve performance of your Industrial Knowledge Graphs with upgraded Data Modeling UI
There’s also much more to explore and discover. Dive into the latest release notes and uncover all the additional features and improvements designed to take your industrial data journey to new heights.
These brand new additions will be available to you on March 5th 2024. We would love to hear your feedback here on Cognite Hub over the coming weeks. We also want to thank all our community members for your contributions so far. We're eager to continue this collaborative process with you, seeking your valuable input on both existing and upcoming product features. We encourage you to continue to submit your Product Ideas here in the community, to help us understand how we can continue to evolve Cognite Data Fusion to fit your needs. Let's keep this momentum going!
Here’s a short video summarizing the release highlights
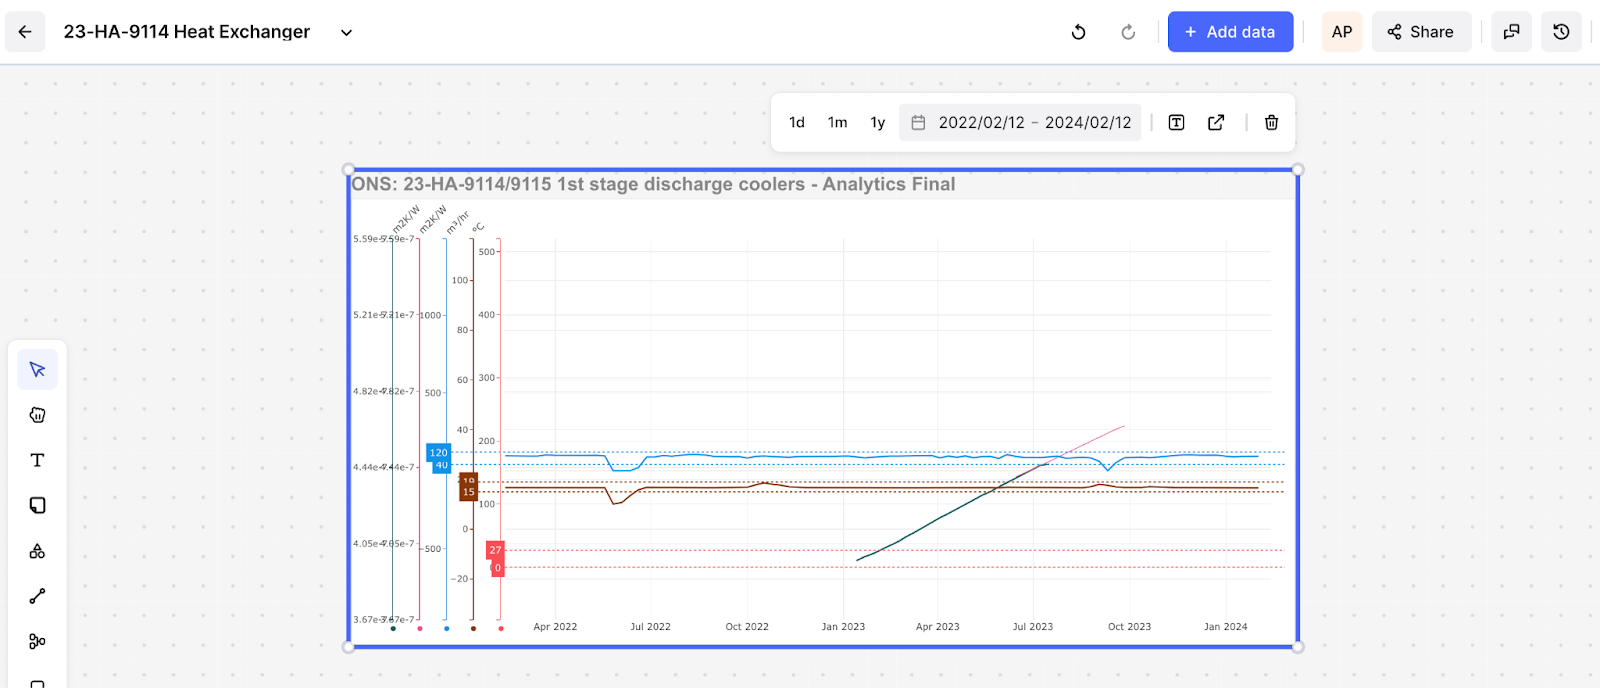
Increase efficiency of troubleshooting and root cause analysis with updates to Industrial Canvas
When troubleshooting complex issues, a lot of time is spent on finding the right data and sharing it across disciplines. Collaborating in a visual, seamless way reduces the time and effort to resolve issues and get your systems back to optimal performance. This release we are introducing new features to Industrial Canvas which improve support of troubleshooting and root cause analysis for our industrial users.
In Industrial Canvas, we are enhancing sticky notes so that you can build cause map diagrams for your root cause analysis. Another highly requested feature has been a tighter integration and user experience between Industrial Canvas and Charts. You will now be able to open and view your Charts directly in Industrial Canvas, collecting all essential data in one place, and removing the need to go back and forth between browser tabs.
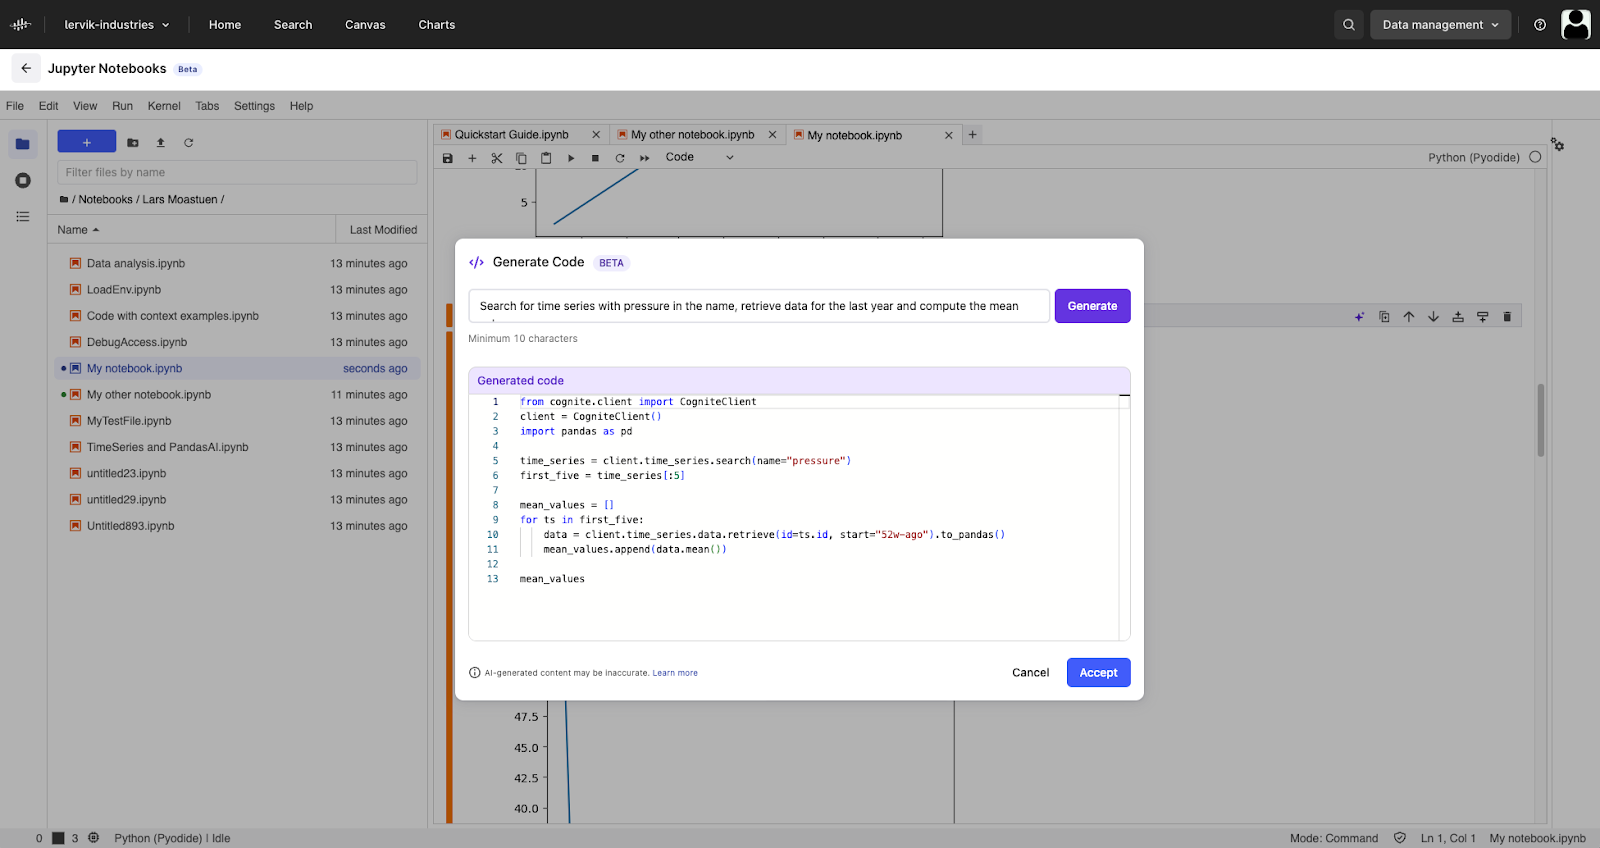
Improve productivity in Jupyter Notebooks with enhanced AI co-pilot and collaboration
Jupyter Notebooks in Cognite Data Fusion allows you to write and run Python scripts without leaving your browser. The notebooks use your current user credentials when logged in to Cognite Data Fusion, which removes the need for additional authentication steps and risk of getting access to restricted data. Since its initial launch late last year, Jupyter Notebooks has become an increasingly popular feature for our more technical users such as data scientists and engineers, being used to explore data and prepare for building data pipelines and solutions.
In this release we are further improving Jupyter Notebooks’ AI copilot. The copilot has received a major visual overhaul making it simpler to use, together with elevated knowledge of Cognite Data Fusion and its Python SDK increasing its accuracy. You will also find an upgraded user interface showing where notebooks are stored. This allows you to differentiate between notebooks stored inside or outside of Cognite Data Fusion, enabling sharing of individual notebooks and prevention of potential data loss.
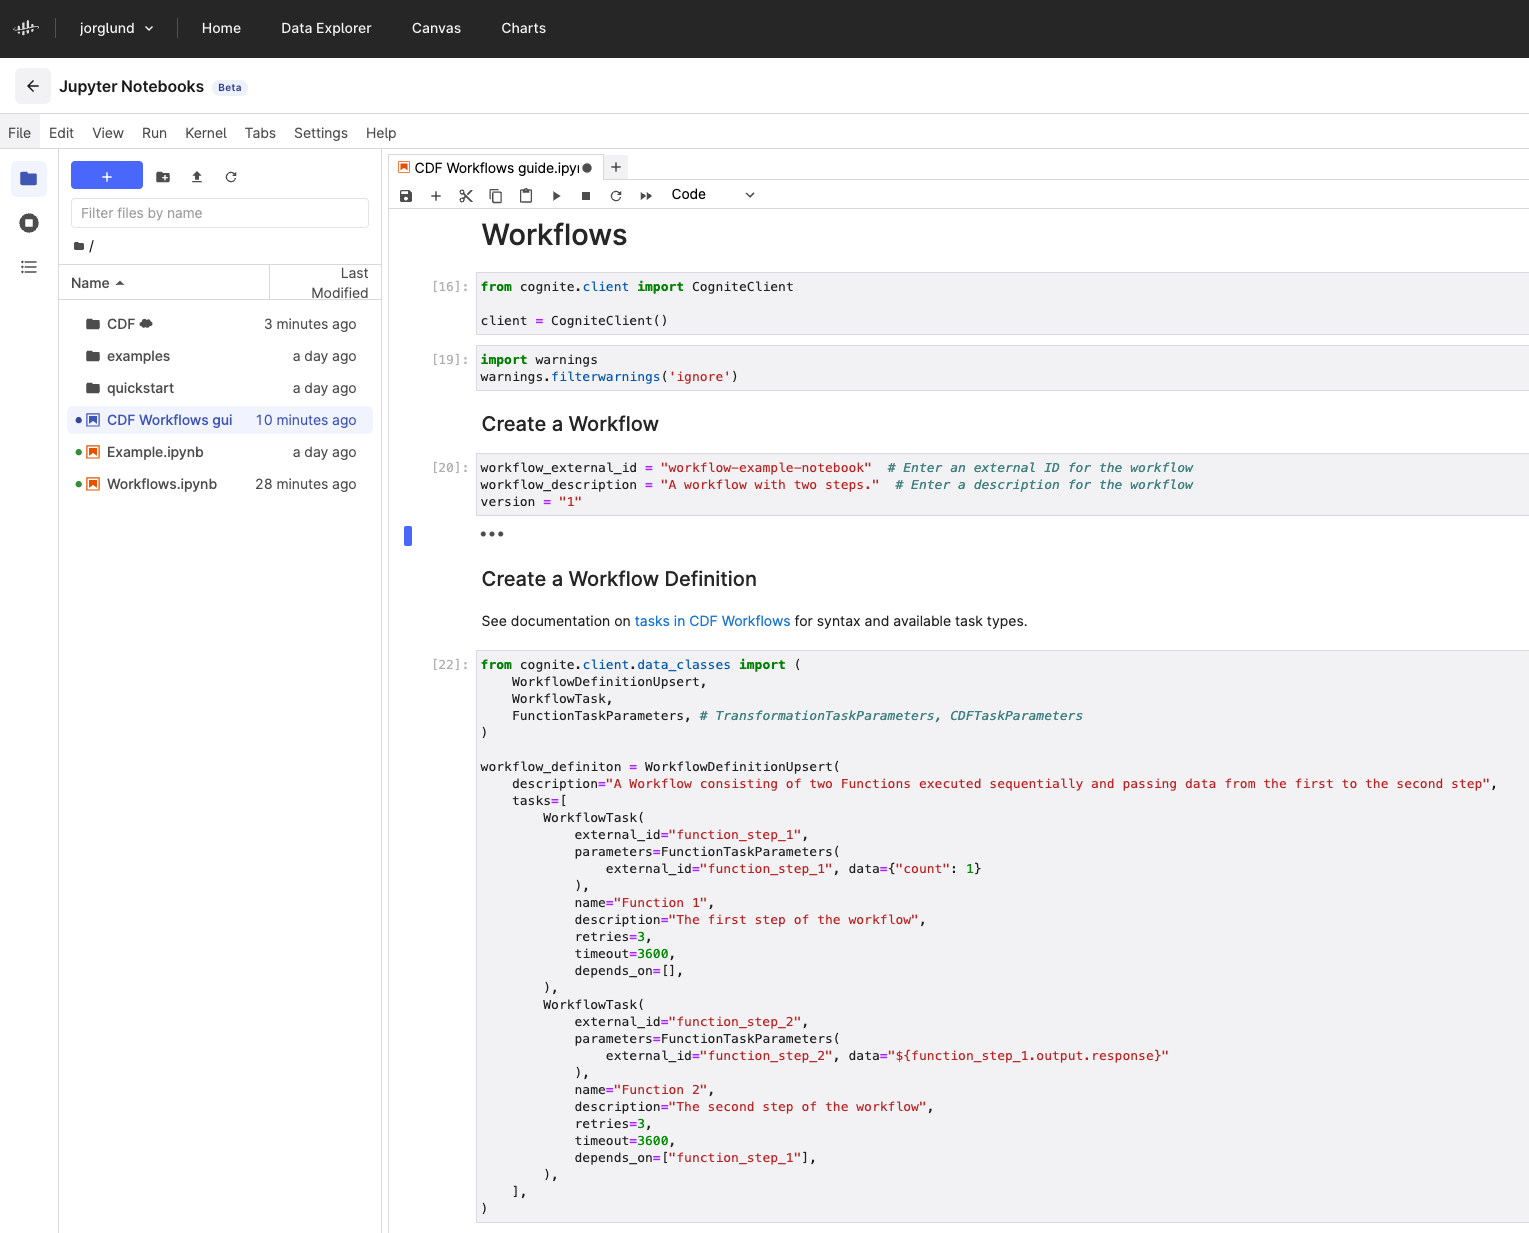
Increase robustness of data pipelines with Data Workflows
All data in Cognite Data Fusion rely on industrial data being efficiently onboarded and contextualized, while maintaining the quality and trust in the data. Data managers, data engineers, and data scientists usually manage several data processes to prepare Industrial Knowledge Graphs and other solutions for their organization’s consumers.
The introduction of Data Workflows allows you to orchestrate execution of Cognite Data Fusion’s data processing features, such as Transformations and Functions. This enables significantly increased observability and control of the end-to-end data pipelines, leading to improved performance and faster scaling.
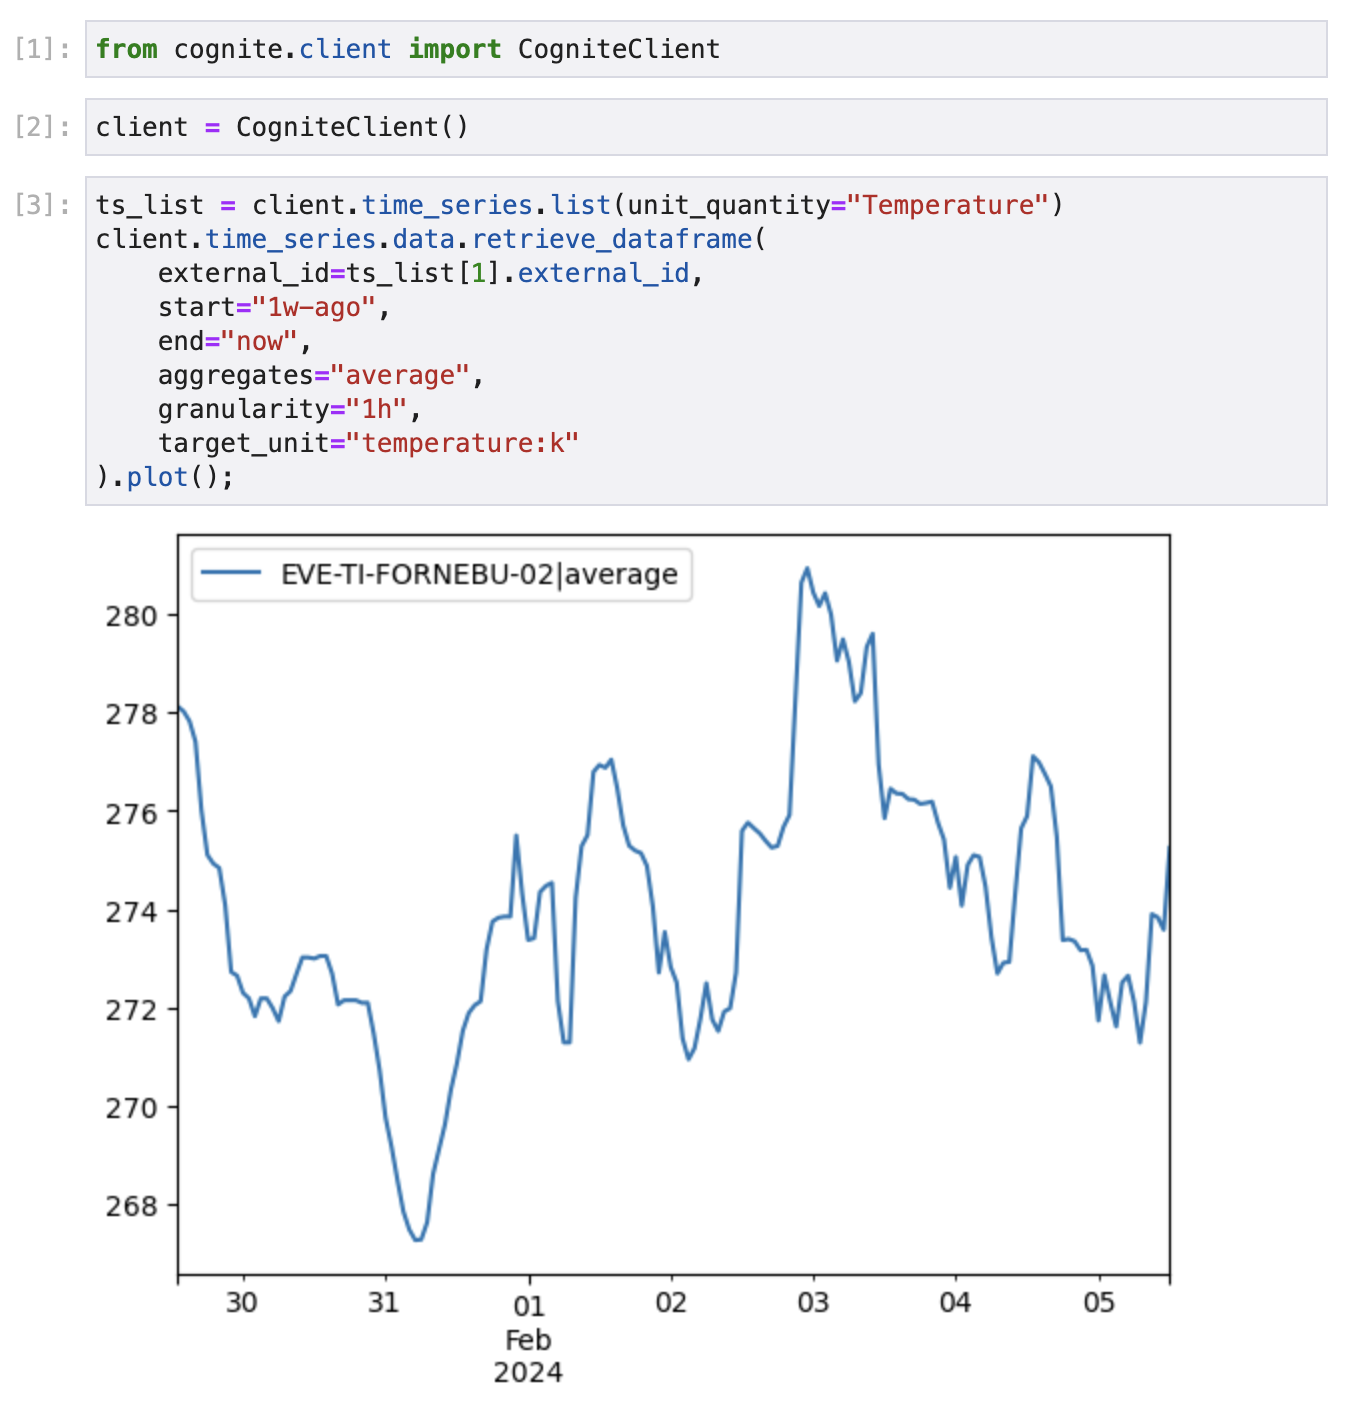
Accelerate solution development with new Unit Conversion and Time Series enhancements
Cognite Data Fusion’s core data resource types, such as Data Modeling and Time Series, are extensively used in creation of Industrial Knowledge Graphs and solutions tailored for solving industry specific problems. Enabled by Cognite Data Fusion’s DataOps capabilities and SDKs, solution builders are often setting up calculations and similar processes to prepare their industrial data to fit their use cases. In this release, we are introducing a set of new features for Unit Management and Time Series aiming to expand this toolkit. These new features cover several commonly requested gaps in Cognite Data Fusion, which we believe will simplify and accelerate the experience with exploring and consuming relevant data, and deploying solutions on top of it.
Building upon our latest Unit Management features, which allows you to assign units of measure to Time Series instances and Data Modeling properties, you will now be able to consume data in the unit of measure relevant to you. This allows you to spend less time on error prone unit conversions, both for simple and one-off data exploration to more complex solution building.
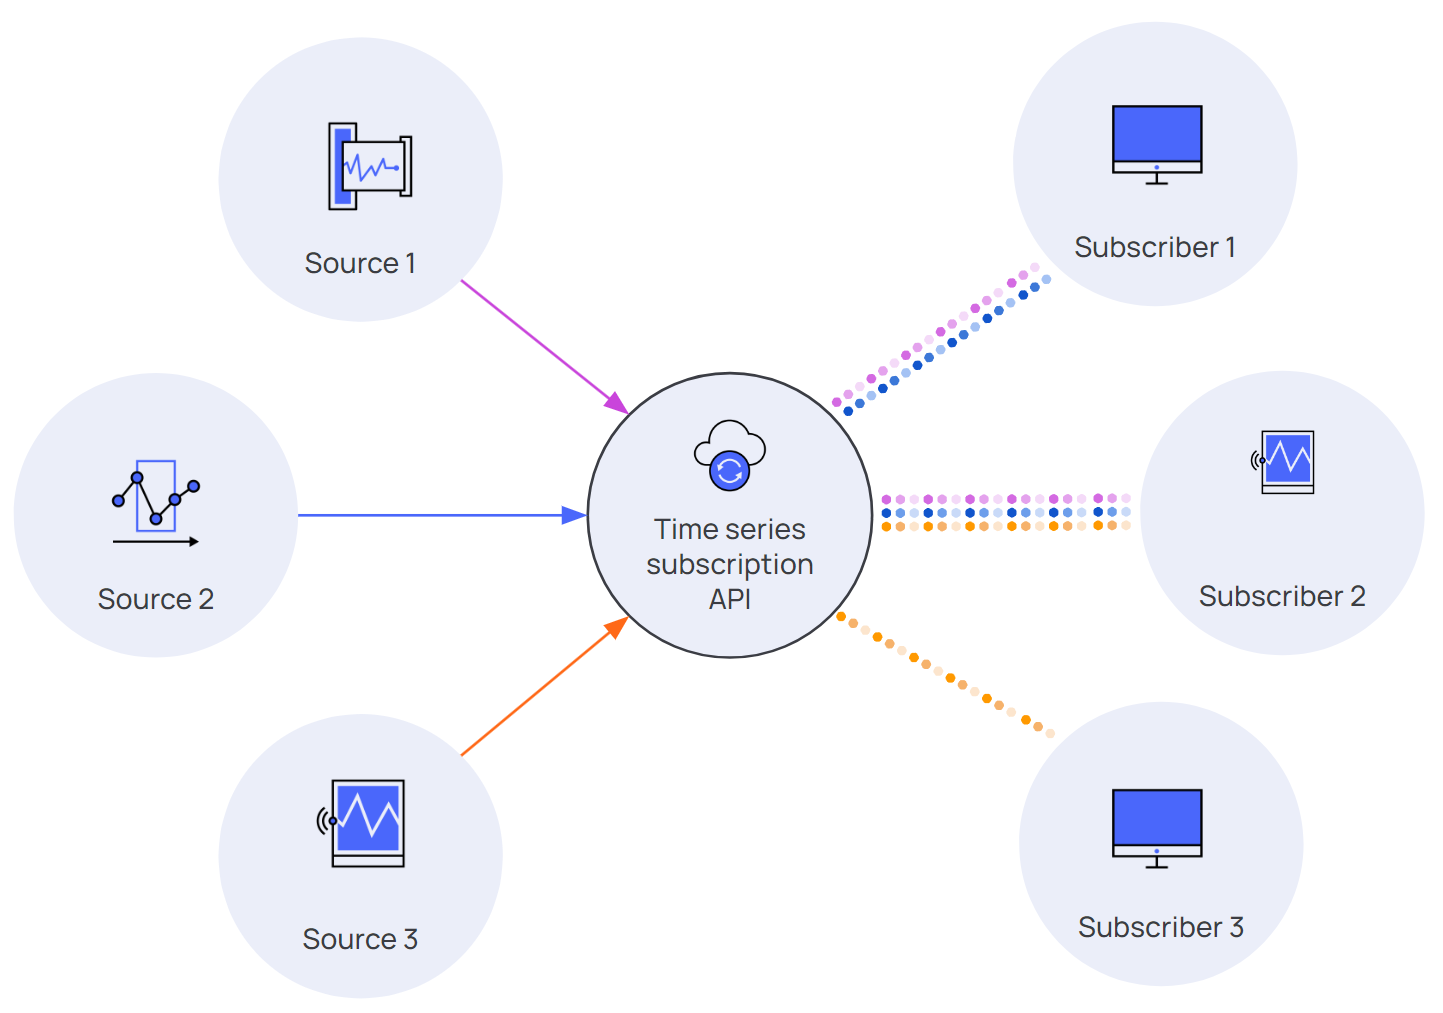
For Time Series, we are introducing Subscriptions and Data Quality Status Codes. Up until now, our users have had to download the full range of data points to get updates on new or changed data points. This increases the risk of performance challenges, especially for solutions or processes dependent on large data volumes. The new Subscriptions feature allows you to set up one or more Subscriptions across Time Series, and obtain only the latest and changed data instances that are to be used in e.g. dashboards or calculations. Data Quality Status Codes allows you to represent the data quality of Time Series data points according to the OPC-UA standard. This provides you with the option to choose how to handle data instances not considered good enough, instead of them automatically being removed when being ingested into Cognite Data Fusion from source systems. The added insight into the quality of data instances will increase trust in the industrial data, both for solution builders and data consumers.
Improve performance of your Industrial Knowledge Graphs with upgraded Data Modeling UI
Data Modeling provides you with the flexibility to define your own Industrial Knowledge Graphs based on relevant industry standards, your organization’s own data structures and use cases, or a combination of all of these. Large, and often complex, Industrial Knowledge Graphs might be needed to represent the full extent of your industrial data across disciplines. This increases the risk of the Industrial Knowledge Graph having reduced performance for its consumers, such as query timeouts and slow response times.
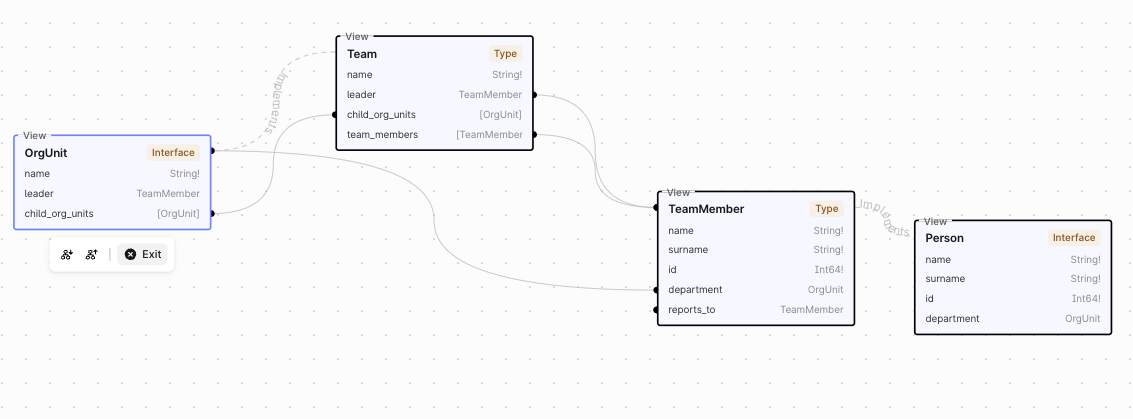
With this release, we are enhancing the Data Modeling user interface in Cognite Data Fusion to show how relationships between data is stored, and what can be queried. This allows you to better understand how you can optimize your graph to delivert the best possible performance and stability for your consumers.
You can find more detailed information on the updates in the release notes on our Documentation portal.


