

 Check the
documentation
Check the
documentation Ask the
Community
Ask the
Community Take a look
at
Academy
Take a look
at
Academy Cognite
Status
Page
Cognite
Status
Page Contact
Cognite Support
Contact
Cognite Support

Implemented
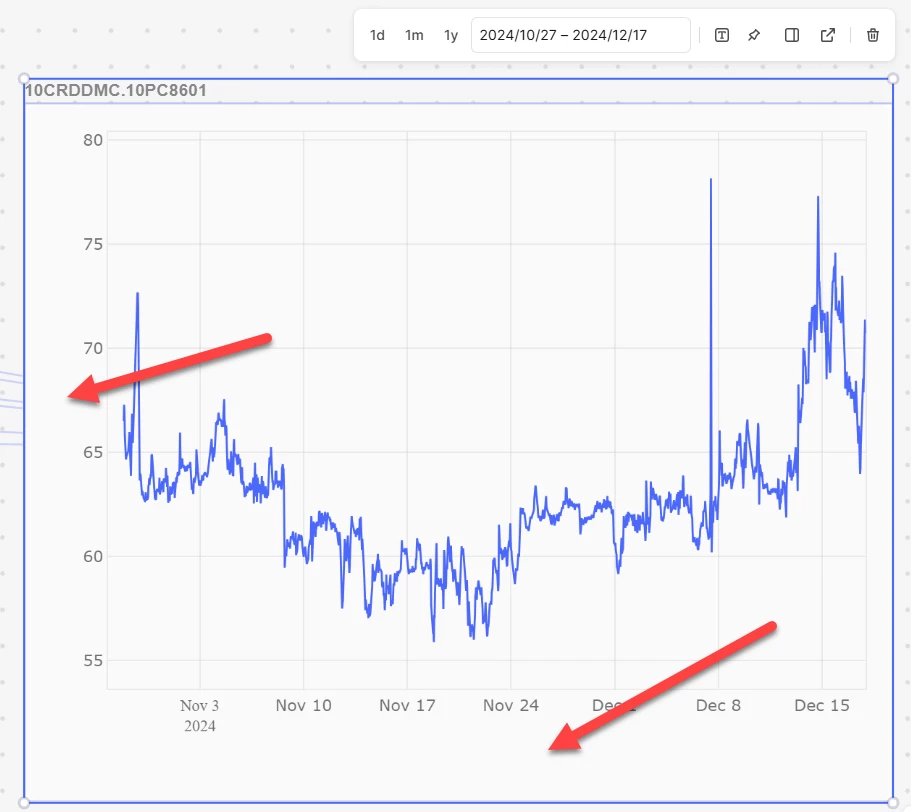
Define graph axis for time series data in Industrial Canvas
Define graph axis for time series data in Industrial Canvas. In this example below, date range and UOM are needed to understand the graph effectively.
Submitted at the request of the Cognite project team
