Cognite Data Fusion: Search Time Series Tag by Asset and its hierarchy and ability to roll up to the parent or child in Charts

Related products: Charts

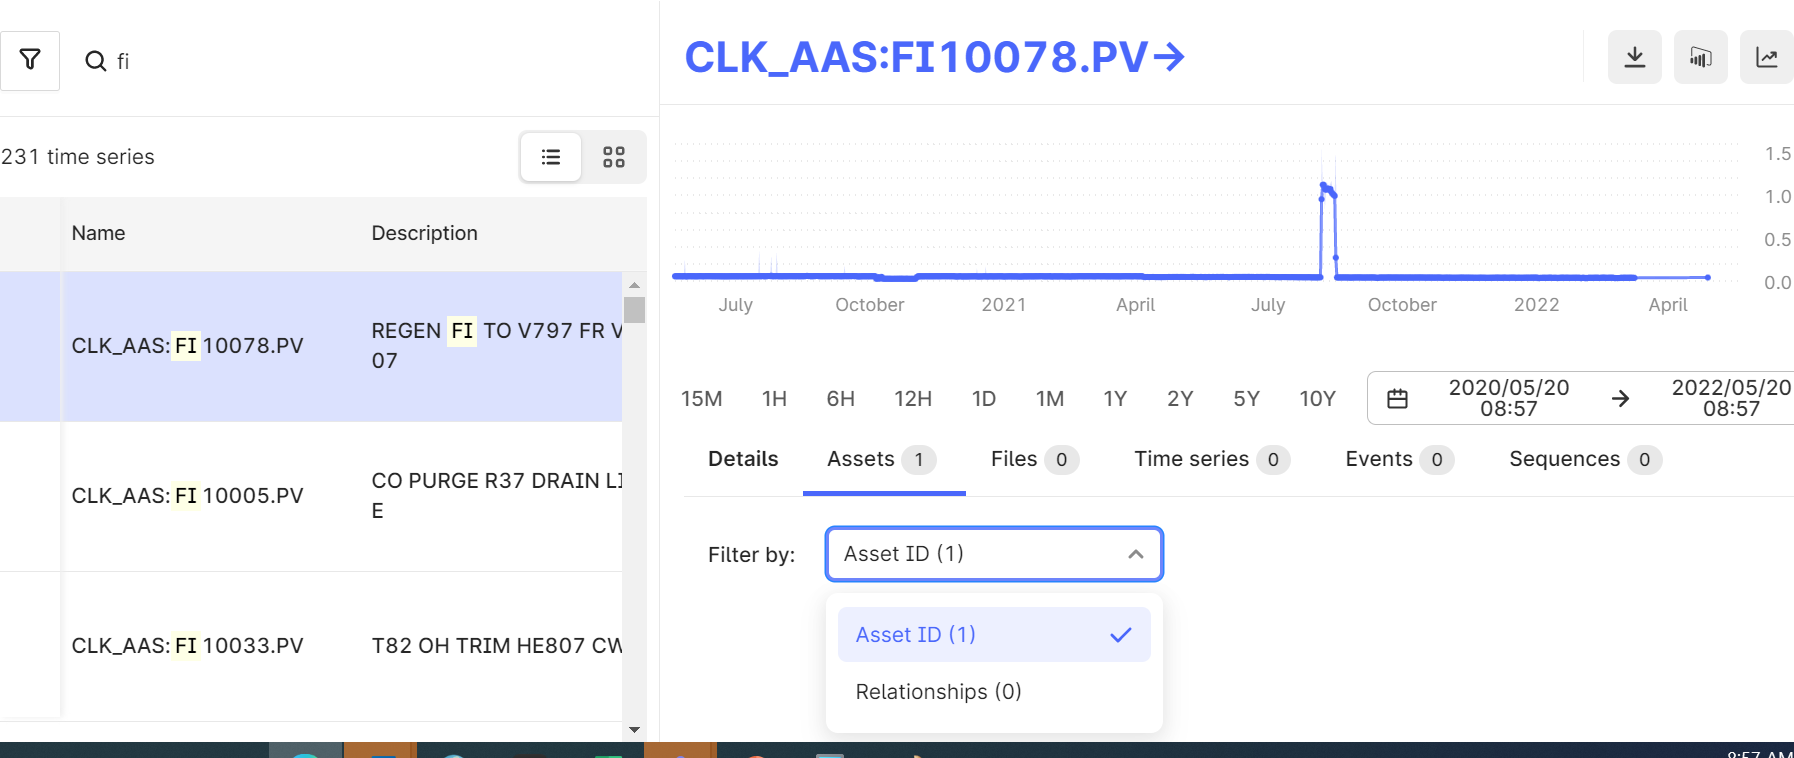
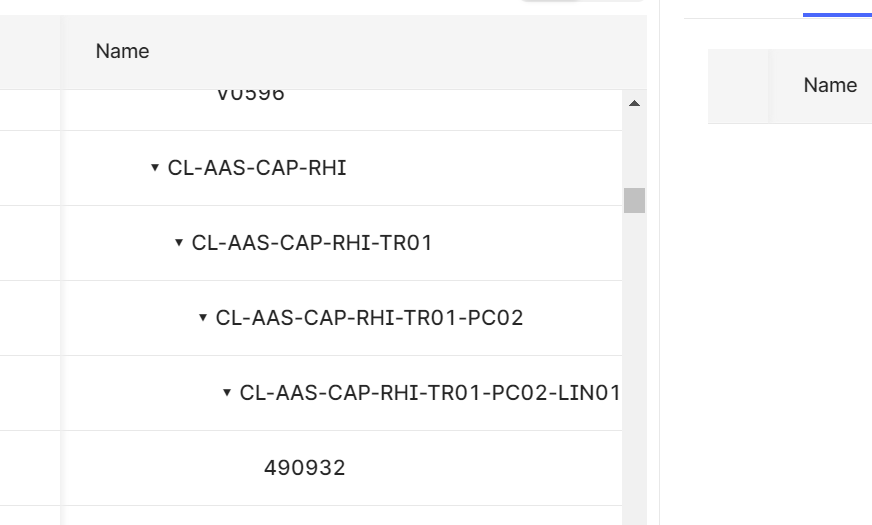
This is an important functionality to allow searching OSI PI Tags by Assets and then also searching by asset hierarchy levels and rolling up all time series tag or going down a level to get all the time series tag

Hi Ibrahim and thanks for reaching out with this recommendation.

I’m not sure I understand exactly what you mean by “rolling up all time series tags or going down a level to get all time series tags.” Would you be able to give an example? 

In the meantime, I wanted to show you some functionality that we have in Charts today to see whether it serves the needs you’re requesting here:


 1. Search time series related to a specific asset / equipment tag

As you can see in the GIF above, when using the “Equipment tag” tab in the search panel, we’re displaying the results of your query where the time series are grouped by their corresponding asset (equipment tag). if you’d like to search among the time series related to a specific asset, you can then click on the asset name or the “View all” button (if there are > 5 results) in the results list to open the sub-search option. 

However, I have access to the celanese project and it looks like the data is still being contextualized. The assets are not matched with their corresponding time series, which means this functionality is not yet available in Charts. Once the entity matching has been completed, then this feature will work immediately!

Also, by default, the assets (equipment tags) without any time series data related to them are hidden from this search results list in Charts. The reason being that there are often “empty” assets with no time series in a CDF project. This can crowd up the search results list and, since anyone using Charts is going to be interested in or looking for time series data, we decided to hide these “empty” assets by default to simplify the search results list. You can toggle this setting in the filters dropdown, to the right of the search field. See GIF below for a demonstration on how this works.


2. Facility (root asset) filter

In the search panel, we also have a “Facility” (or “root asset” as it’s sometimes referred to) filter that was recently added to the UI. As its name suggests, this allows you to filter the results (both assets and time series) according to a particular top level asset in your CDF asset hierarchy. See GIF below for a demonstration.

Again, since it doesn’t look like the celanese project has been fully configured and contextualized with this asset hierarchy structure, this feature won’t work quite properly. But as I wrote above, once this is completed then this feature will function as expected and intended.


Thanks and looking forward to hearing more of your thoughts on this request!

If you’d like to schedule a time to discuss over a Teams call in more detail, please don’t hesitate to let me know here or over email (eric.stein@cognite.com).


Thank you for the detailed explanation. I need come clarifications: 

  1. A time series tag in CDF has either an asset relationship as a direct link to Asset ID or relationship. Please see below. In Charts, when you search for an equipment tag - does it pull the time series that are link to asset ID or relationships or all? 
  2. Regarding rolling up time series tag - what I mean here is the ability to search on a hierarchy to get all the time series tags for Charts. For example, in CDF I have asset hierarchy and I would like to see all Time Series tags for CL-AAS-CAP-RHI or any system or level in hierarchy. At the moment, in charts i can only search for a specific asset and not by any hierarchy level or gorups.

  3.  I can talk 8am Mon or Wed next week Houston Time at ibrahim.alsyed@Celanese.com  if you want to send me an invite to talk more.


Thank you for the clarifications and examples. To respond to each point:

1. Currently, we're only pulling from the Asset ID <-> Time series links. We do not support other relationships in our search at this time — reason being, that we haven't had any customers who have this need when using Charts. If this is something you'd like us to support, definitely let me know. 

2. Now I understand what you mean, thanks. So if you were to search for the top level asset in your screenshot, CL-AAS-CAP-RHI, you would see all time series linked to that asset and to its children.

We don't currently offer a way to view/navigate the search results as an asset hierarchy tree, but this has not been prioritized highly since we've only heard feedback that it's a "nice to have" not a "need to have" functionality. Is this something that would be helpful for you in Charts? How would you rate it's importance?

3. Perfect, I'll send you a calendar invite for next week and we can discuss this together while looking at the data in the Celanese CDF project. 


Thank you.


  1. I think we need both links. For example - a Flow Indication PI Tag can be connected to a Flow Transmitter but I also probably want a relationship to the pipe or another equipment. So in Charts, we should be able to see both. For example, if i search for a vessel, i need the level indication time series but in reality it will not show up as its only tied to Level Transmitter as an asset Tag.
  2. Yes - very much needed as an alternative UX. 
  3. Lets talk


Updated idea statusNewGathering Interest

Let’s definitely look at some example cases in the celanese project data when we speak. I’ll also relay your need for an asset hierarchy viewer UX back to the team.

Looking forward to talking with and meeting you tomorrow!


Eric, can we prioritize item (2), this is popping up at our site as a need to search at any level and get all the children time series data and then plot your chats?


Eric, can we prioritize item (2), this is popping up at our site as a need to search at any level and get all the children time series data and then plot your chats?

@ibrahim.alsyed yes, I’ll mark item (2) as increased priority and importance for you all. I’m still unsure as to exactly when we’ll be able to implement this functionality, but I’ll be sure to update you as soon as the team and I know more. 


Gathering InterestPlanned for development

@ibrahim.alsyed, we’ve just released an update to Charts and time series connected to child assets are now available in the search panel — ref. item (2) above. I’ve tested it for myself on the Celanese project and it works exactly as intended. Definitely give it a try for yourself and let us know how it performs.

As I mentioned in my post in the Charts group, we’re working on adding support for displaying time series data related to equipment tags (assets) via relationships as well. This is a part of the team’s current development sprint, so it should also be available in the coming weeks. Once it is, I’ll post another update here and then we can close this product idea request. 


It looks like this has been implemented, no? @Eric Stein-Beldring  @ibrahim.alsyed  @Anita Hæhre ?


Planned for developmentImplemented