Charts feature request - Stick ruler on chart area and copy numerical ruler values to clipboard

Related products: Charts

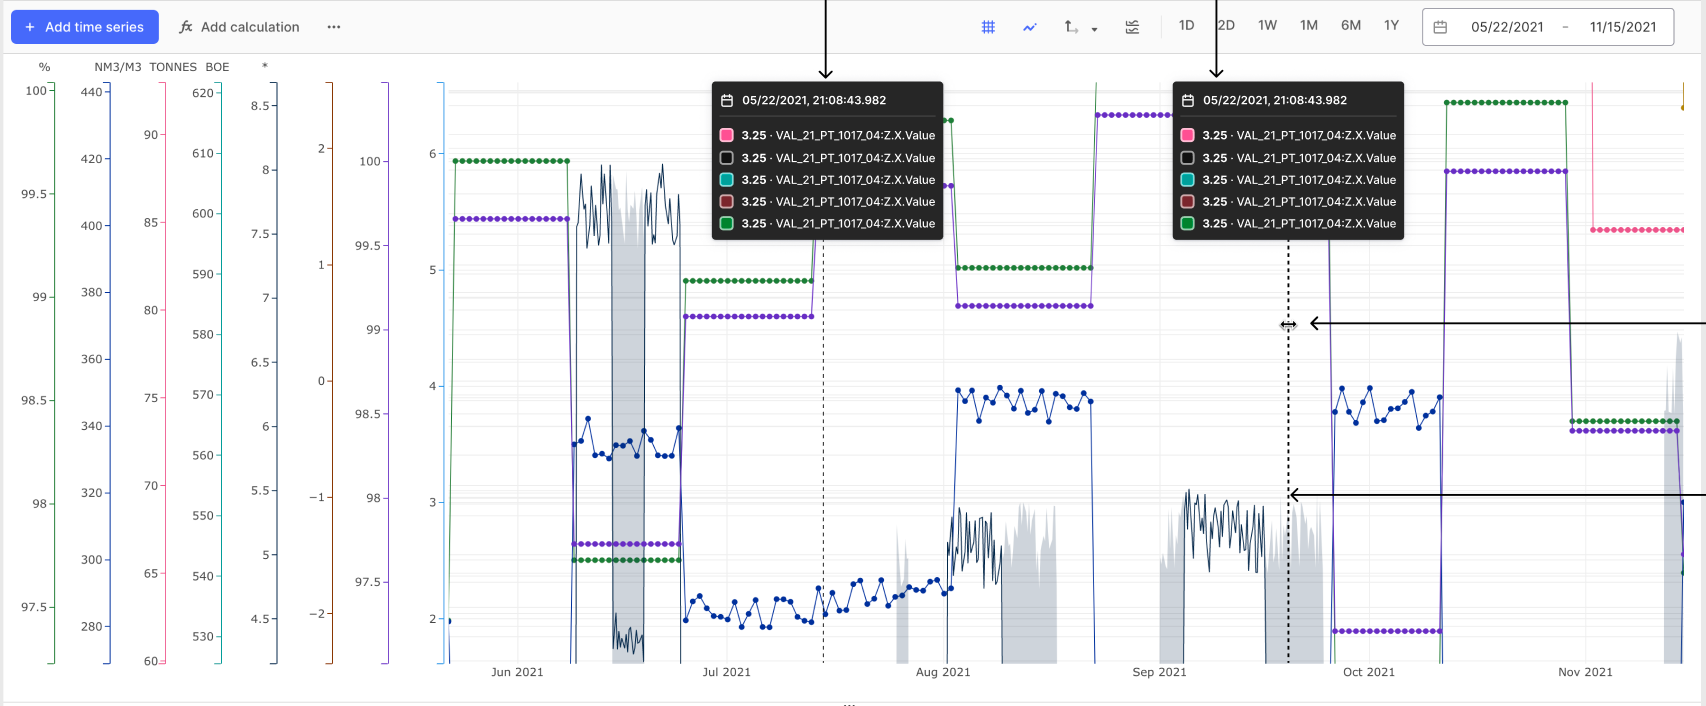
In the chart area in Cognite Charts, it would be beneficial to lock the ruler in place on the screen, cause I often have to switch windows and write down say inside excel. and I want to copy values from charts, now i do that through taking a printscreen but it is quite cumbersome to open mspaint to copy it in, and find the window and the values inside the printscreend browser-window. could be expanded to be able to add in multiple rulers. such that the rules with numerical values stay on the screen even if I change windows and move the mouse away from the charting area. 


It would even be nice, if with a button the values along the ruler could be store to clipboard as text string such that they can be copyed straight into a say excel spreadsheet or into any text-document.

Hi, @Stig Harald Gustavsen 

Thank you for a great suggestion. An it’s great that you describe your current workflow and what can be improved in it. If I may ask some clarifying questions so I understand what you mean when you say “ruler”.

  1. Is it the ability to add one or more markers that show the values at a specific point in time? Like in the concept sketch below?


  1. And he additional feature to have a “save to clipboard” button or similar so you dont have to write it down manually the values at each ruler?


Best regards, Knut


Hi @Knut Vidvei 


A: you are correct

B: you are also correct

Thanks for understanding the features 😊


Stig


NewGathering Interest

This feature is something that many end users are accustomed to in other tools and would definitely bring value to the broader charts usage community. Looking forward to its implementation.


Into the cliboard it would also be great to get the names and the ID’s / External-IDs of the timeseries used aswell :) 


I’d say this is a key feature missing from Cognite Charts that end users are accustomed to having in PI processbook / vision. Without this feature, many engineers are reluctant to move over to charts because they use this daily in their troubleshooting to compare how things are changing over time in their minds by seeing these values. 

This - along with the ability to see multiple charts in one “canvas” 😉 - are the main things holding people back from moving away from their existing PI screens. 


Great feedback, Richard.

And thank you for including the workflow examples of the engineers at Hess.

Knut


It looks like this other Hub request is the same: Cognite Hub 

Perhaps we merge votes? Where does this feature stand?


This is being worked on now and will be released as a part of the feb release ! please stay tuned for more updates from our end on this regard.


Apologies i meant to say the march release as that is when the next official release of CDF with new features will be in place.


The markers functionality is now available in Charts. Please look for the button called slider to use this feature.