Check the
documentation
Check the
documentation Ask the
Community
Ask the
Community Take a look
at
Academy
Take a look
at
Academy Cognite
Status
Page
Cognite
Status
Page Contact
Cognite Support
Contact
Cognite Support

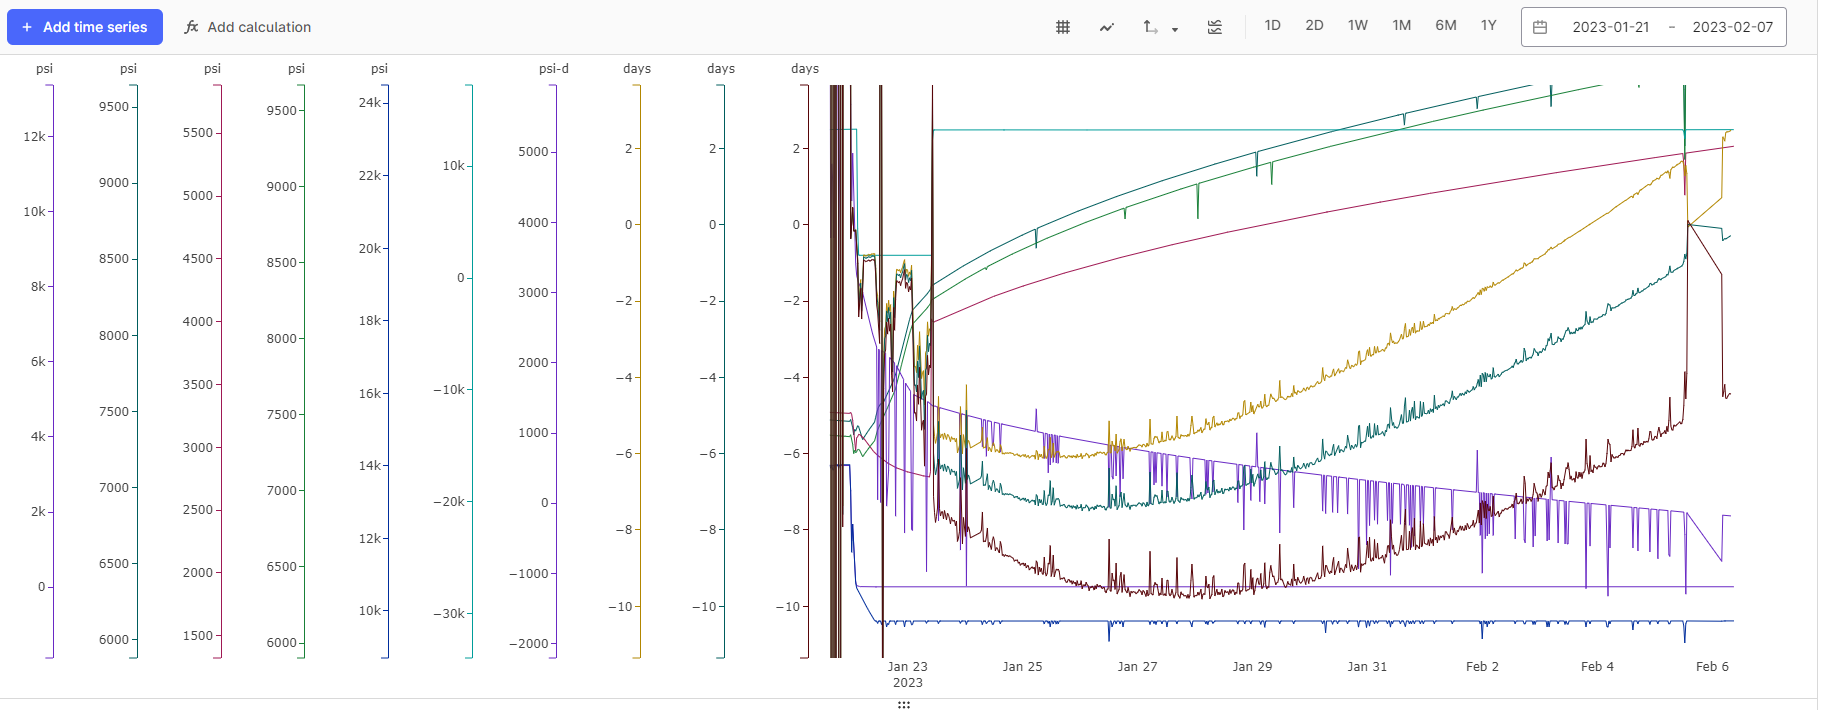
Following up from a separate thread (Cognite Charts: y-axis Spacing and Labeling), adding the capability to place timestamped milestones (e.g. when an event started, when a remediation test started, etc) would add value. I sometimes need to display a time series only to mark an event (e.g. when a valve was opened, when a specific chemical injection start/ends, etc), and this leads to many times series being displayed at once (see example below). If milestones could be marked on the chart, that would be really useful. Maybe it could be added as some sort of custom time series (similar to how to “Add Calculation”) fixed to a specific timestamp and could appear as a vertical line with some marker at the top - this is just me thinking out loud.
Thanks,
Richard