

 Check the
documentation
Check the
documentation Ask the
Community
Ask the
Community Take a look
at
Academy
Take a look
at
Academy Cognite
Status
Page
Cognite
Status
Page Contact
Cognite Support
Contact
Cognite Support


Overview
The TSJM Analysis Notebook is a web-based interactive tool designed for exporting, visualizing, and analyzing Transformation Job Metrics from Cognite Data Fusion (CDF). Built with marimo.io, it provides a modern, Python-driven interface to monitor performance, analyze concurrency, and troubleshoot transformation jobs.
For details on module, please see the Readme files :
- README.md - High level information about the module
- README-marimo-analysis.md - Detailed setup and usage guide
- README-marimo-coding-best-practices.md - Development best practices
- COMMON_JSONL_FORMAT.md - Data format specification
Download & Install locally (Cognite Toolkit)
Prerequisites
Before you start, ensure you have:
- A Cognite Toolkit project set up locally
- Your project contains the standard cdf.toml file
- Valid authentication to your target CDF environment
- Access to a CDF project and credentials
- cognite-toolkit >= 0.6.61
Access: You need appropriate permissions in your CDF project to enable feature flags. Contact your CDF administrator if you don't have access.
Step 1: Enable External Libraries
Edit your project’s cdf.toml and add:
[alpha_flags]
external-libraries = true
[library.cognite]
url = "https://github.com/cognitedata/library/releases/download/latest/packages.zip"
checksum = "sha256:26c69a82e7a67706a17a36a36ed2ceecfb24aaf73e559a219a48081f62c59316"
This allows the Toolkit to retrieve official library packages, including the Quickstart DP package.
📝 Note: Replacing the Default Library
By default, a Cognite Toolkit project contains a
[library.toolkit-data]section pointing tohttps://github.com/cognitedata/toolkit-data/....These two library sections cannot coexist. To use this Deployment Pack, you must replace the
toolkit-datasection withlibrary.cognite:
[library.toolkit-data][library.cognite]github.com/cognitedata/toolkit-data/...github.com/cognitedata/library/...The
library.cognitepackage includes all Deployment Packs developed by the Value Delivery Accelerator team (RMDM, RCA agents, Context Quality Dashboard, etc.).
Step 2: Add the Module
Run:
cdf modules add
⚠️ NOTE: if using
cdf modules init . --cleanThis command will overwrite existing modules. Commit changes before running, or use a fresh directory.
Step 4: Select the: CDF Transformation Job Metrics Analysis Notebook
(NOTE: use Space bar to select module, confirm with Enter)
From the menu, select:
- Tools and Accelerators: Tools and accelerators for CDF projects (select with “Enter”)
- CDF Transformation Job Metrics Analysis Notebook (Select with “Space bar”, confirm with “Enter”)
Step 3: Verify Folder Structure
  modules

     └── tools

         └── notebooks

             └── cdf_transformation_jobs_metric_explorer
If you want to add more modules, continue with yes (Y); otherwise choose no (N).
Proceed with creation (Y) to generate the folder structure and files for your selected modules.
Usage
Prerequisite
- For accessing CDF and downloading metrics you need to provide a
.envfile.
- The syntax and options are fully compatible with the
.envfile used for Cognite Toolkit. So you can use an existing one, or create it manually. See chapter "Environment Configuration" for details.
- To run this solutions in an isolated Python environment with minimum setup complexity,
uvis recommended. Nothing else is required, but the.envfile and themarimo-tsjm-analysis.py:)
Installation notes for uv you can find here:
- https://docs.astral.sh/uv/getting-started/installation/#standalone-installer
- Once installed,
uvxis available too and used in the next step as a shortcut foruv run
# switch into this directory

cd ./modules/tools/notebooks/cdf_transformation_jobs_metric_explorer
If you have the environment and prerequisite as specified in the README - run the command:
# Run in app-mode (only visuals no code editing possible)

uvx --python 3.13 marimo run --sandbox --no-token marimo-tsjm-analysis.py
Now the app will open up in a browser window (if not blocked by your security settings)
Start by setting your path to the .env file used / created by CDF Toolkit. If you don’t have an .env file please see the README file pointed to above on this.
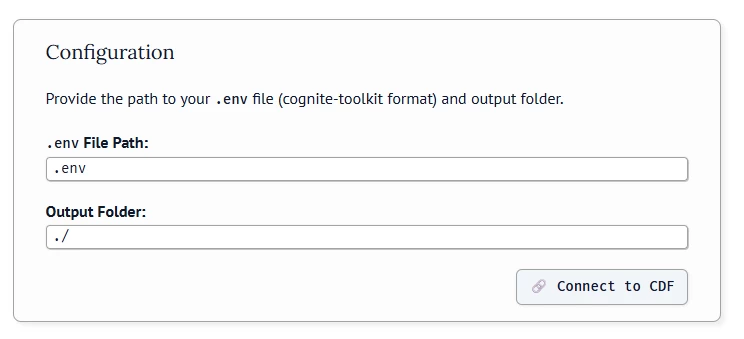
If you are using a .env file in your root folder, the path to the .env file is: ./../../../../.env
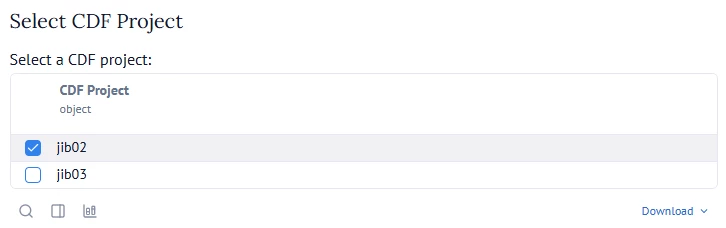
Click on the “Connect to CDF” button and select the project that you want to look into from the list provided by the connection to CDF:
Now you select the range of data that you want to look into. The Tool will do a full load of your selected range of data into a JSON file stored locally ( in the output folder you provided in the above configuration). This will then make the Transformation metrics data available for further analytics.
⚠️ Note:Tip is to do a test selection first to get an idea of what you can do with the tool - then go back and select the ranges you want for a deeper insight into the Transformation metrics.
When export is complete you get :
with a path to where your Json file is stored.
In Chapter 3: Load Data - the default suggested path is from your loaded data - but you can modify this and go back to older exported data.
Click the “Load data” button to continue. Now you can continue to explore your data.
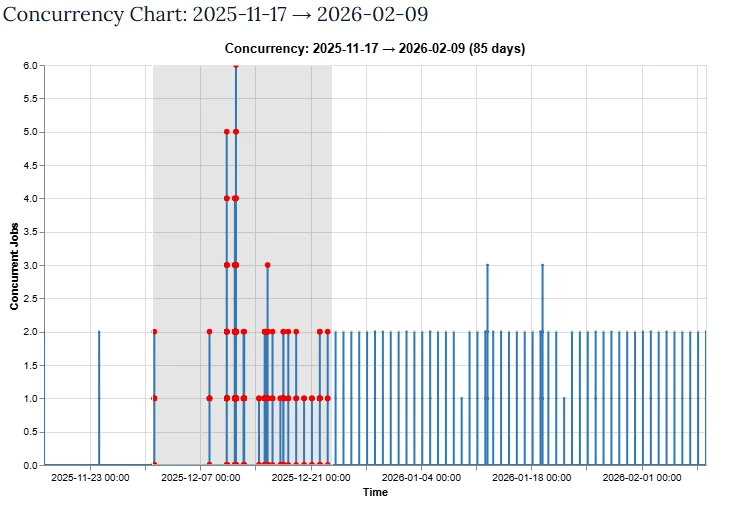
Concurrency Dashboard and Drilldown
Visualize job concurrency patterns to identify scheduling conflicts and resource contention.
- Interactive date range selection
- Peak concurrency detection
- Drill-down into active jobs at any point in time
Select dates to inspect either by selecting dates in list or by marking a data range in chart:
View and inspect the jobs in your select range, on Transformation metrics as:
- Completed
- Failed
- Cadence
- Cadence_sec
- Avg Runtime
- Runtime in sec
Or by job metrics:
- Job ID
- Status
- Start & end time
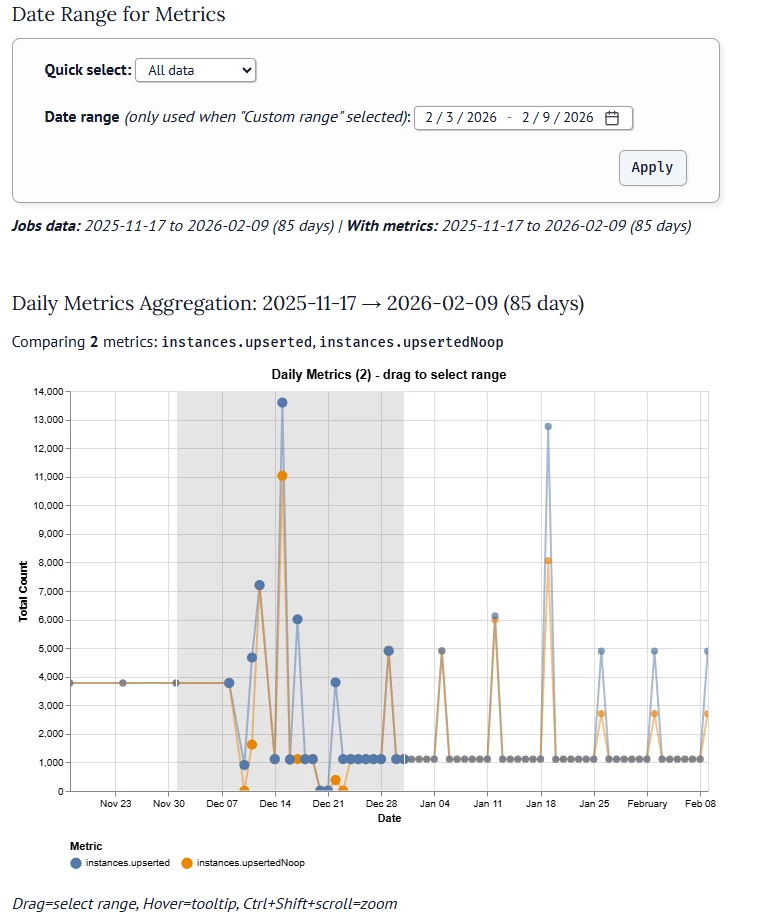
Metrics Dashboard and Drilldown
Analyze transformation metrics trends over time.
- Multi-metric comparison charts
- Transformation-level details
- Trend analysis per transformation
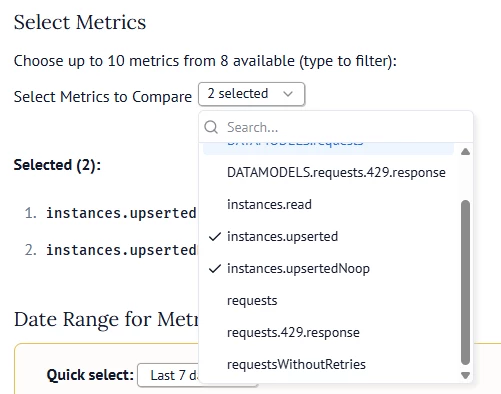
Start by selecting the metrics:
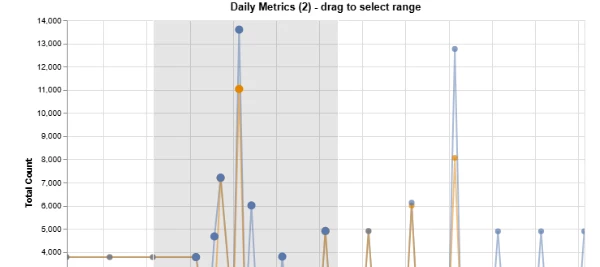
Now you can use the graph to select a date range to deep dive on peaks and find the root cause of potential problems:
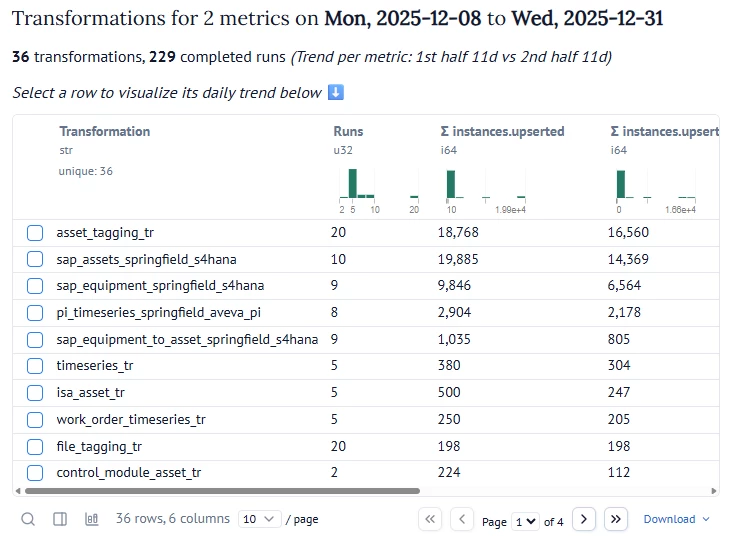
In my example below I sorted on NOOP. As we can see 16.560 of the 18.768 operations are not making any change to the data model in CDF - since the data already exist. This means that the ‘asset_tagging_tr’ Transformation is not using any incremental change control before it submits data - and needs to be fixed. This starts with the way data is written to RAW, then the implementation of the Transformation - as using ‘is_new()’ or other restructuring to optimize.
Next you can also save and export the data for further processing or sharing.
Support
For troubleshooting or deployment issues:
-
Refer to the Cognite Documentation
-
Contact your Cognite support team