

 Check the
documentation
Check the
documentation Ask the
Community
Ask the
Community Take a look
at
Academy
Take a look
at
Academy Cognite
Status
Page
Cognite
Status
Page Contact
Cognite Support
Contact
Cognite Support

CDF Project Health Dashboard
Authors:
Overview
The CDF Project Health Dashboard module provides a solution for measuring, monitoring, and visualizing the health of CDF resources (extraction pipelines, workflows, transformations, and functions) scoped by dataset. It consists of two main components:
- Project Health Metrics Function (external_id:
project_health_handler) - Computes health metrics for a given dataset and time range and saves them as a JSON file in CDF - Streamlit Dashboard (
project_health_dashboard) - Loads the pre-computed metrics file and displays health gauges, status donuts, resource tables, and recent errors across tabs
This module helps data engineers and operations teams understand how well their CDF project resources are performing over time across four resource types:
- Extraction Pipelines - Run status, success/failure rates, and recent errors
- Workflows - Workflow run health and status distribution
- Transformations - Transformation run health and status distribution
- Functions - Function call health and availability
Module Components
project_health/
├── data_sets/
│   └── project_health_apps.DataSet.yaml   # Dataset for function and Streamlit app assets
├── functions/
│   ├── project_health_handler/
│   │   ├── handler.py                     # Main Cognite Function: runs fetchers, writes JSON to CDF Files
│   │   └── fetchers.py                    # Fetchers for extraction pipelines, workflows, transformations, functions
│   └── project_health.Function.yaml       # Function configuration
├── streamlit/
│   ├── project_health_dashboard/
│   │   ├── main.py                        # Streamlit dashboard entry point
│   │   ├── requirements.txt               # Python dependencies
│   │   └── src/                           # Dashboard source
│   │       ├── __init__.py
│   │       ├── config.py                  # App config
│   │       ├── configuration.py           # Configuration tab (run function, dataset, time range)
│   │       ├── tabs.py                    # Tab renderers (overview, extraction pipelines, workflows, etc.)
│   │       ├── charts.py                  # Chart helpers
│   │       ├── ui_components.py           # Shared UI components
│   │       └── utils.py                   # Utilities
│   └── project_health_dashboard.Streamlit.yaml  # Streamlit app configuration
├── module.toml                            # Module metadata
└── README.md                              # This file
Deployment
Prerequisites
Before you start, ensure you have:
- A Cognite Toolkit project set up locally
- Your project contains the standard
cdf.tomlfile - Valid authentication to your target CDF environment
Step 1: Enable External Libraries
Edit your project's cdf.toml and add:
[alpha_flags]
external-libraries = true

[library.cognite]
url = "https://github.com/cognitedata/library/releases/download/latest/packages.zip"
checksum = "sha256:795a1d303af6994cff10656057238e7634ebbe1cac1a5962a5c654038a88b078"
This allows the Toolkit to retrieve official library packages.
📝 Note: Replacing the Default Library
By default, a Cognite Toolkit project contains a
[library.toolkit-data]section pointing tohttps://github.com/cognitedata/toolkit-data/.... This provides core modules like Quickstart, SourceSystem, Common, etc.These two library sections cannot coexist. To use this Deployment Pack, you must replace the
toolkit-datasection withlibrary.cognite:
Replace This With This [library.toolkit-data][library.cognite]github.com/cognitedata/toolkit-data/...github.com/cognitedata/library/...The
library.cognitepackage includes all Deployment Packs developed by the Value Delivery Accelerator team (RMDM, RCA agents, Context Quality Dashboard, Project Health Dashboard, etc.).
⚠️ Checksum Warning
When running
cdf modules add, you may see a warning like:WARNING [HIGH]: The provided checksum sha256:... does not match downloaded file hash sha256:...
Please verify the checksum with the source and update cdf.toml if needed.
This may indicate that the package content has changed.This is expected behavior. The checksum in this documentation may be outdated because it gets updated with every release. The package will still download successfully despite the warning.
To resolve the warning: Copy the new checksum value shown in the warning message and update your
cdf.tomlwith it. For example, if the warning showssha256:da2b33d60c66700f..., update your config to:[library.cognite]
url = "https://github.com/cognitedata/library/releases/download/latest/packages.zip"
checksum = "sha256:da2b33d60c66700f..."
Step 2: Add the Module
Run:
cdf modules init .⚠️ Disclaimer: This command will overwrite existing modules. Commit changes before running, or use a fresh directory.
Step 3: Select the Dashboards Package
From the menu, select:
Dashboards: Streamlit dashboards and visualization modules
Then select CDF Project Health Dashboard.
Step 4: Verify Folder Structure
After installation, your project should contain:
modules/
    └── dashboards/
        └── project_health/
Step 5: Deploy to CDF
Build and deploy:
cdf build
cdf deploy --dry-run
cdf deploy
⏱️ Note: Function Deployment Time
After running
cdf deploy, the Cognite Function (project_health_handler) may take 2-5 minutes to fully deploy. The Streamlit dashboard will be available immediately, but the function needs time to initialize before you can run it from the dashboard.If you see "Function not available" when running the health computation in the Configuration tab, wait a few minutes and try again. You can verify deployment status in CDF:
- Navigate to Data management → Build solutions → Functions
- Look for
project_health_handlerand check its status
Deployment troubleshooting
Deploy error: Function must have a space set (DATA_MODELING_ONLY)
If you see:
ERROR (ResourceCreationError): Function 'project_health_handler' must have a space set when the project is in DATA_MODELING_ONLY mode.
your CDF project is in DATA_MODELING_ONLY mode. In that mode, function code is stored as a CogniteFile in a data model space, not in a dataset. The Function YAML must include a space field. Add space: project_health (or your chosen space) to project_health.Function.yaml if you use this mode.
Getting Started (Step-by-Step Guide)
This section provides detailed instructions for first-time users. Follow each step carefully.
Step 1: Open CDF Fusion in Your Browser
- Open your web browser (Chrome, Firefox, or Edge recommended)
- Go to https://fusion.cognite.com (or your organization's Fusion URL)
- Log in with your company credentials
- Select your CDF project from the project selector (top-left corner)
Step 2: Navigate to the Dashboard
- Look at the left sidebar menu
- Click on "Industrial Tools" (it may show as an icon with a gear/wrench)
- In the expanded menu, click on "Custom Apps"
- You will see a list of available Streamlit applications
- Find and click on "CDF Project Health Dashboard"
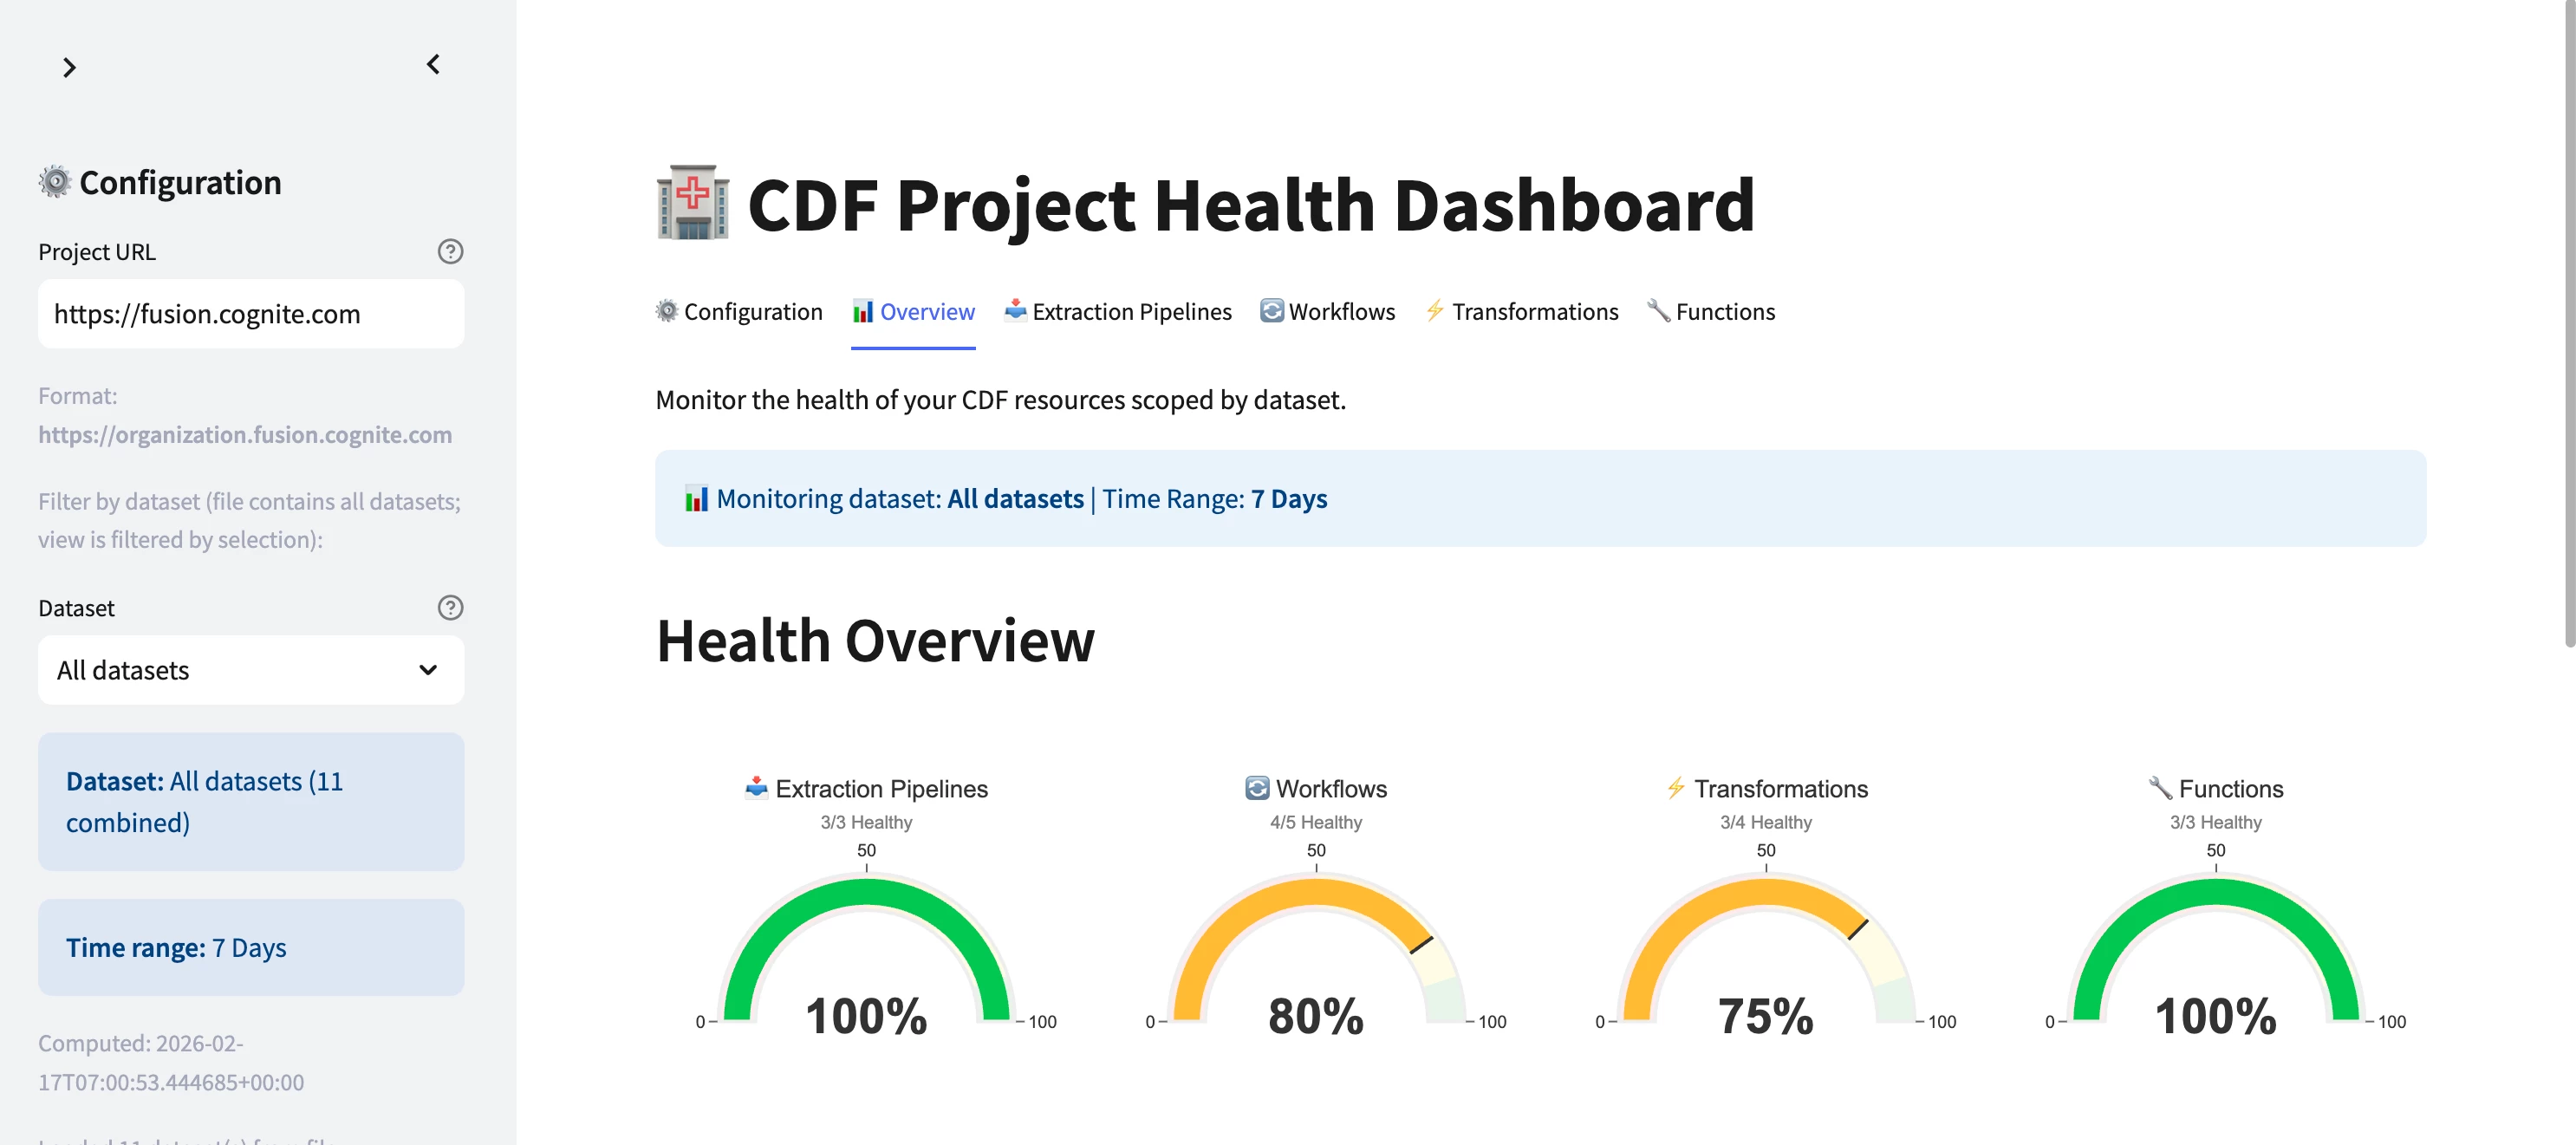
- The dashboard will open with tabs: Configuration, Overview, Extraction Pipelines, Workflows, Transformations, Functions
Step 3: Understanding the Dashboard Layout
When the dashboard opens, you will see:
- Left Sidebar: Project URL, dataset filter (if the metrics file contains multiple datasets), time range of the loaded metrics, and a Refresh data button
- Main Area with Tabs:
- ⚙️ Configuration (first tab - use this to run the function)
- 📊 Overview - Summary gauges and recent errors across all resource types
- 📥 Extraction Pipelines - Pipeline health and status
- 🔄 Workflows - Workflow run health
- ⚡ Transformations - Transformation run health
- 🔧 Functions - Function call health
Step 4: Run the Project Health Function
- Open the ⚙️ Configuration tab (it opens by default)
- Configure the run:
- Dataset (required): Enter the dataset external ID that scopes the resources you want to monitor (extraction pipelines, workflows, transformations, functions linked to this dataset)
- Time range: Choose e.g. "12 Hours", "1 Day", "7 Days", "30 Days", or "Custom" with start/end timestamps
- Uptime thresholds (optional): Percentage thresholds used to classify resources as healthy vs failed (default 75% for each type)
- Run the function: Click the button to invoke
project_health_handler - Wait for the run to complete; the function writes a JSON file (external ID:
project_health_metrics) to CDF Files
Step 5: View Your Metrics
- In the sidebar, click Refresh data to load the latest metrics file
- Select the Overview tab for a high-level summary of health across extraction pipelines, workflows, transformations, and functions
- Use the resource tabs (Extraction Pipelines, Workflows, Transformations, Functions) to see per-resource health, status donuts, and recent errors
Configuration
- Dataset: The function and dashboard are scoped by dataset. Set the dataset in the Configuration tab before running the function. The dashboard can display metrics for a single dataset or for multiple datasets (if the function was run for multiple datasets and the file contains a combined payload).
- Time range: The function computes metrics for the selected time window (12 Hours, 1 Day, 7 Days, 30 Days, or Custom). The dashboard displays the time range used for the loaded metrics.
- Uptime thresholds: Optional percentage thresholds (e.g. 75%) used to classify resources as healthy vs failed. Configurable in the Configuration tab or via function input.
Troubleshooting
"No metrics file yet" or "Could not load metrics file"
Cause: The Project Health function has not been run yet, or the metrics file has not been written.
Solution:
- Open the Configuration tab
- Set the dataset and time range, then run the function
- After the run completes, click Refresh data in the sidebar
- If the file is written to a different dataset, ensure the Streamlit app has read access to that dataset
"Function not available" when running from Configuration tab
Cause: The Cognite Function has not finished deploying.
Solution:
- Wait 2-5 minutes after
cdf deploy - In CDF, go to Data management → Build solutions → Functions and confirm
project_health_handleris "Ready" - Re-run the function from the Configuration tab
Dashboard shows empty or stale data
Cause: The metrics file is from an older run or a different dataset.
Solution:
- Run the function again from the Configuration tab with the desired dataset and time range
- Click Refresh data in the sidebar to clear cache and reload the file
Support
For troubleshooting or deployment issues:
- Refer to the Cognite Documentation
- Contact your Cognite support team
- Join the Slack channel #topic-deployment-packs for community support and discussions
