I am not entirely sure I get your question, but I’ll try to answer as best as I can! 
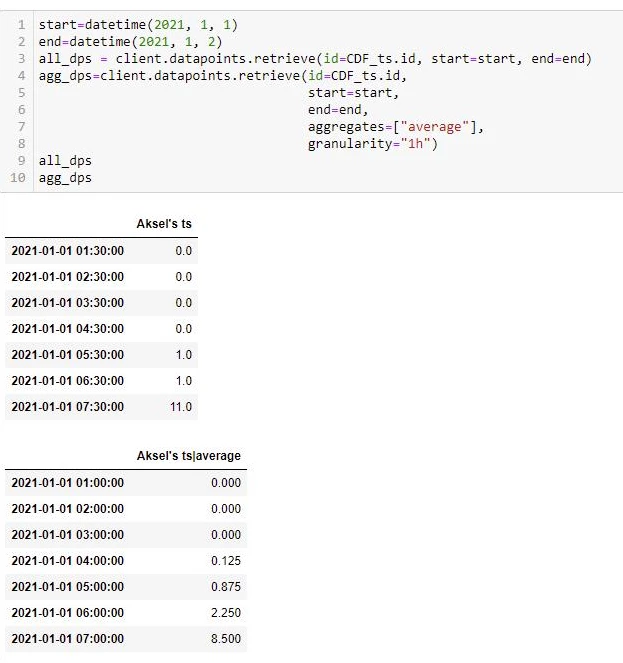
The timestamps for aggregates are labelled by the left boundary. That means the period from 03:00 (inclusive) to 04:00 (exclusive) will be labelled as 03:00.
In your data above, for the aggregate data point at 03:00, with the value 0.0 is zero because all datapoints inside and the two outside points (for the purpose of interpolation to the boundary) are zero.
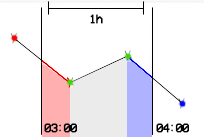
The aggregate data point, at 04:00, with the value 0.125 can be computed as follows:
- From 04:00 to 04:30 the value is 0.0, so this part of the interval does not contribute to the final aggregate value.
- However, in order to find the contribution from the timespan from 04:30 to 05:00, we need to use linear interpolation to find the value at the right boundary, as the documentation specifies. The next value is at 05:30, so this would give an in-between value at the right boundary of 0.5. The average is defined as the time-weigted average (mean distance from 0), so we integrate to find the value/area of this right-angled triangle:
30 (minutes, “triangle length”) * 0.5 (“triangle height”) * 0.5 (formula constant) = 7.5 (minutes). - The average is thus the sum of these two contributions divided by the length of the interval:
(0 + 7.5) / 60 = 0.5^3 = 0.125
I hope this addresses at least some parts of your question!


 Check the
documentation
Check the
documentation Ask the
Community
Ask the
Community Take a look
at
Academy
Take a look
at
Academy Cognite
Status
Page
Cognite
Status
Page Contact
Cognite Support
Contact
Cognite Support