Check the
documentation
Check the
documentation Ask the
Community
Ask the
Community Take a look
at
Academy
Take a look
at
Academy Cognite
Status
Page
Cognite
Status
Page Contact
Cognite Support
Contact
Cognite Support


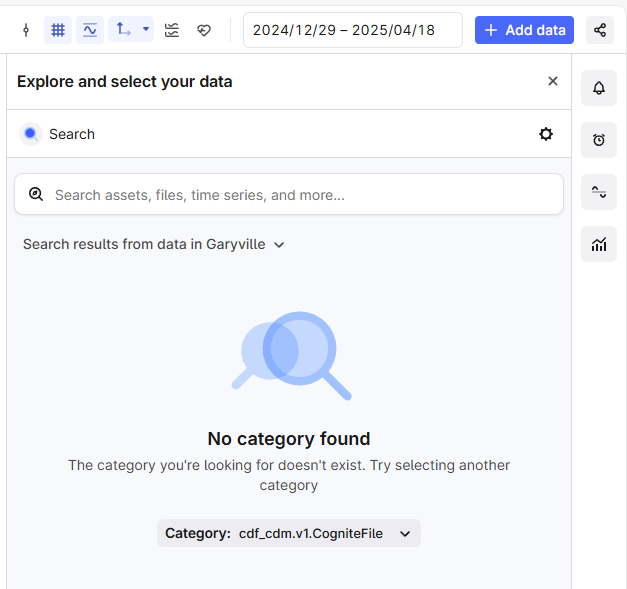
Currently in our Charts instance, if I want to add additional PI-Tag data from the relevant P&IDs, by clicking on the P&IDs icon, it doesn’t automatically load the drawing. I have to select the correct category and then open the correct P&ID. This will be difficult for the end users to navigate.