Check the
documentation
Check the
documentation Ask the
Community
Ask the
Community Take a look
at
Academy
Take a look
at
Academy Cognite
Status
Page
Cognite
Status
Page Contact
Cognite Support
Contact
Cognite Support

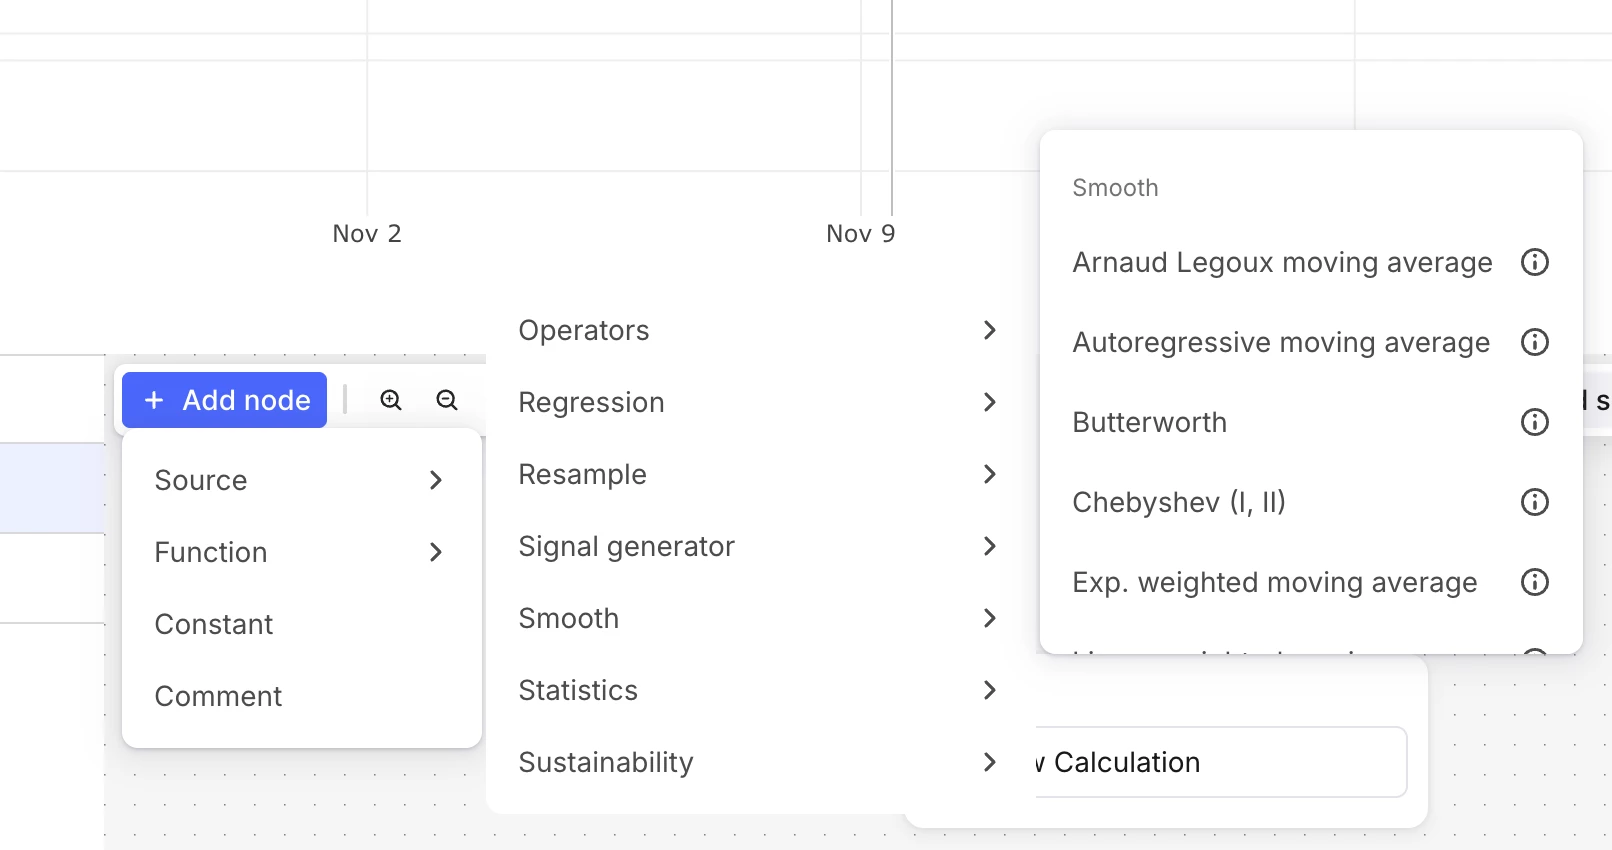
Customers (e.g., TotalEnergies) have requested better documentation for the Functions available in Charts.
Today, many function descriptions in Charts itself are very minimal, and users struggle to understand:
-
what each function actually does
-
the underlying formula or method
-
when the function should be used in real analysis
They would like clearer explanations, formulas and simple usage guidance.
Charts uses Cognite’s Industrial Data Science Library (INDSL), but the current documentation is hard to find from within Charts.
Request: Provide more complete, user friendly documentation for all Functions in Charts, ideally including formula + short “when to use it” guidance (one example of a solution).