
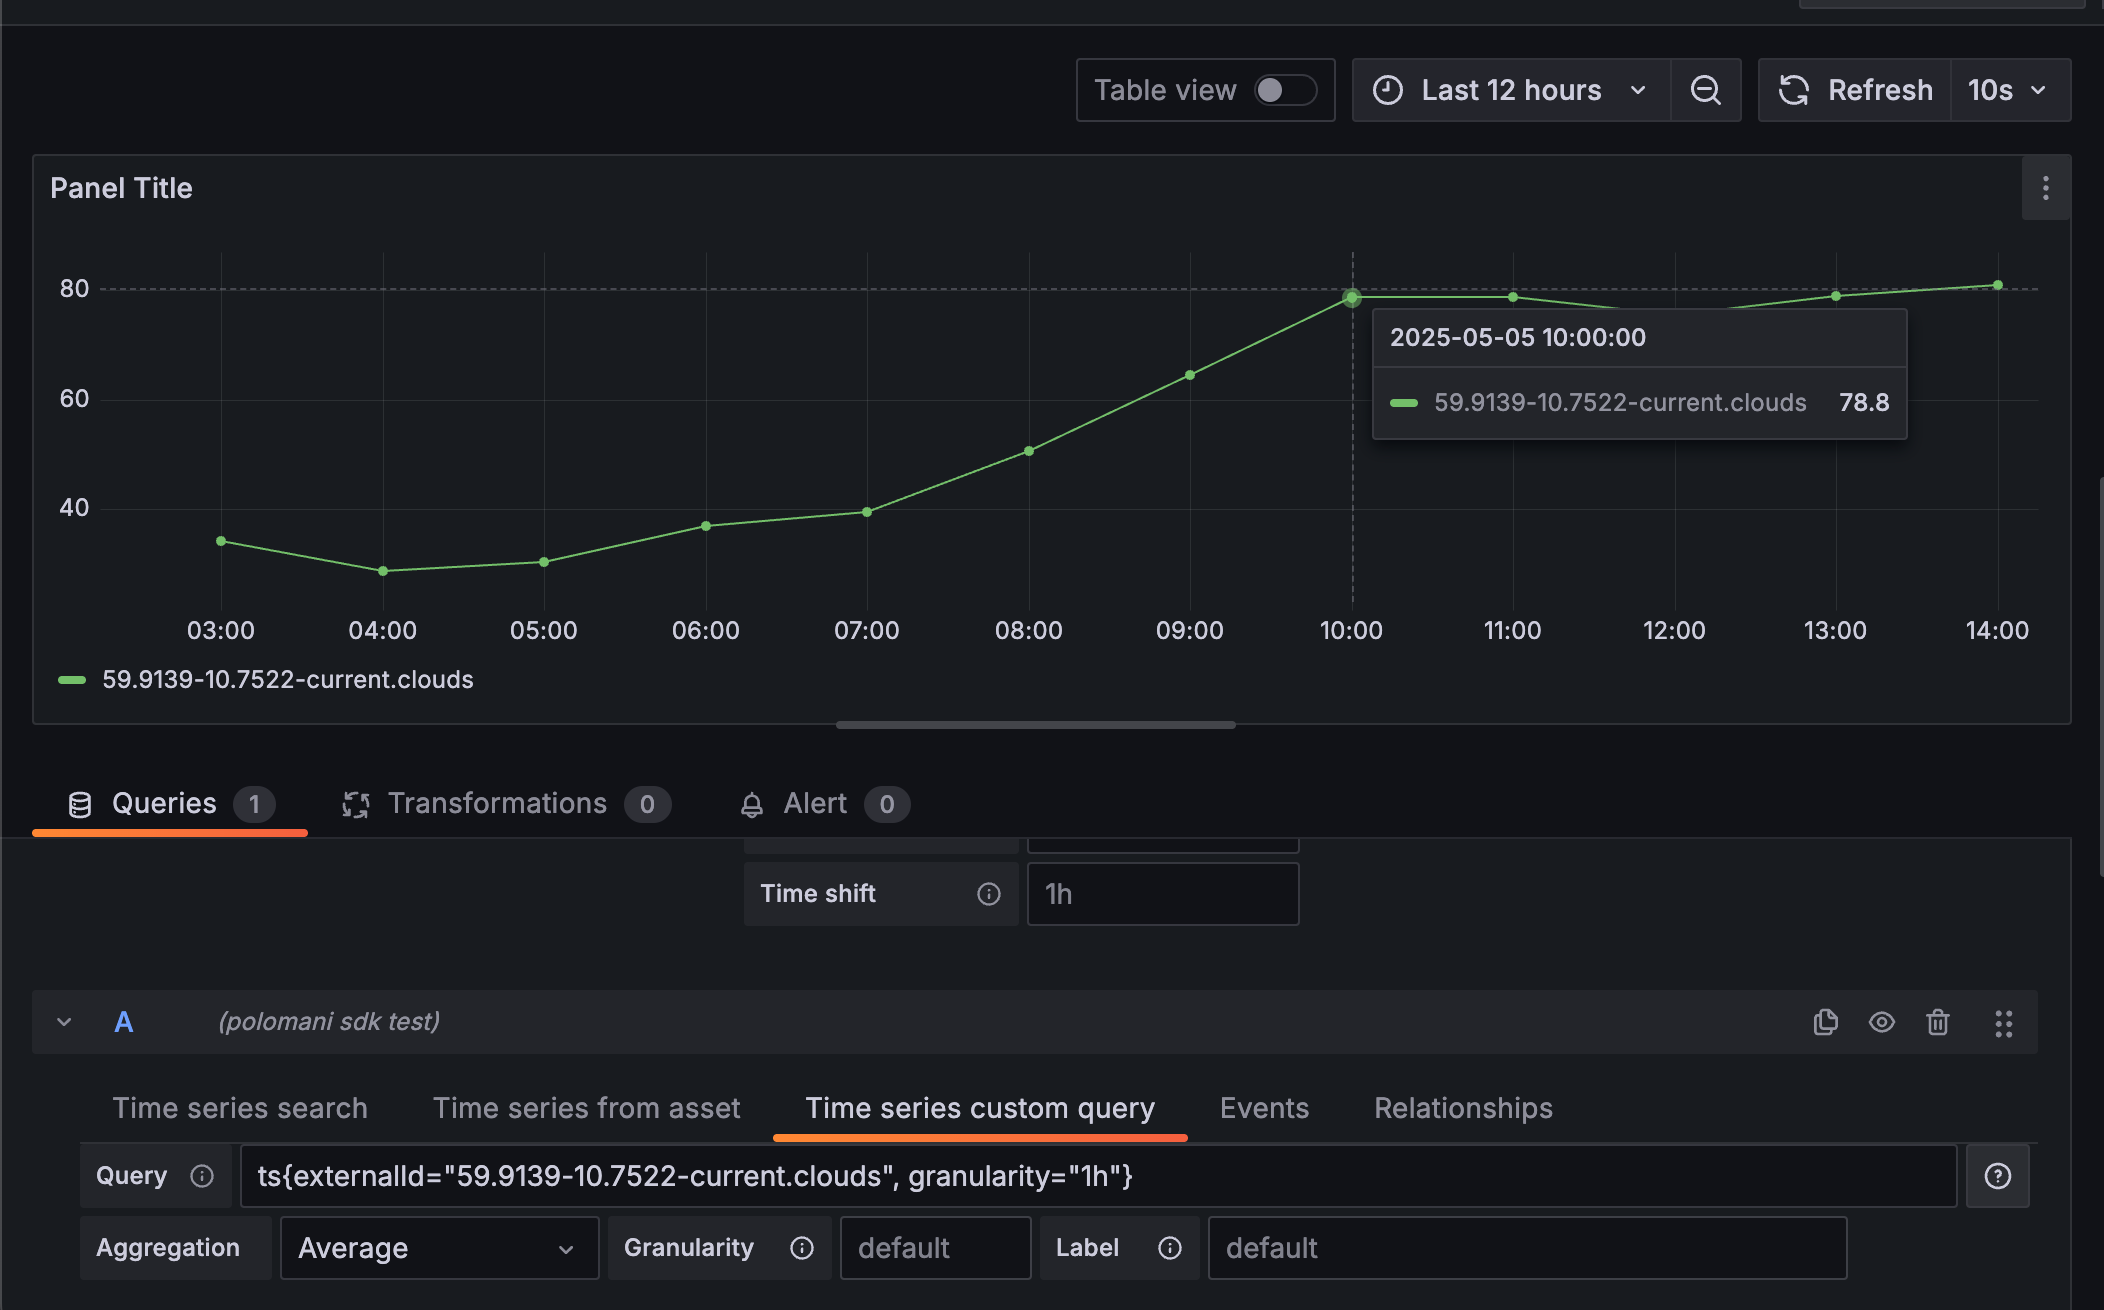
I would like to set time range in grafana custom query using grafana variables. I see we can use:

granularity='GRANULARITY', alignment=ALIGNMENT 

in query and wonder if there is any parameter for range?

I mean if there is a parameter to custom querry the start and end time range in grafana. i would like to use grafana variables to define the time range. 

More specifically, I would like to limit the dashboard time range start and end at sharp hours. 

P.S. I am using a plotly pannel and unfortunately, time override is not available for these pannel types...


@Zahra Ghadyani Hi. You can set the granularity to 1h, would that produce the result you are trying to achieve?
We have no additional paramethers to control the start and end time besides what Grafana provides (e.g. relative time, timeshift).


@ipolomanyi , No 1h granularity is not what I am looking for.

Although there are work arounds to do what I need in Plotly panel, it will not result in the same user experience that we would like to design for our client. 

The CDF QL is currentlt providing limited parameters compare to data sources that support SQL query in Grafana. Does Cognite team consider improving this limitation in future?


@Zahra Ghadyani it’s tradeoff between developer experience, scalability and flexibility, I can only tell that we’ll never be able to achieve the same flexility as SQL provides, unfortunately. The plugin is built on the CDF, which doesn’t expose SQL interface.

It’s still not clear to me why 1h granulatity won’t work here. Can you give a bit more details on why the time range override is needed?

We have plans on extending the datasource capabilities in the future, and overriding the time range might be possible with the custom GraphQl query, but we’ll need to verify that.


Hi ​@Zahra Ghadyani!

I’m the Product Manager responsible for the Grafana connector in Cognite. This is the first time we received a request for custom start/end times in custom time series queries. ​@Mithila Jayalath could you transform this question into a Product idea, so we can track customer interest in this idea and evaluate it for future updates in our connector?


Thank you for considering this product idea. This would enable us to make better user experience for our client that are going to use the Grafana dashboard frequently. Consequently, better dynamic dashboard experiences will promote more clients to choose a cloud service...