Gathering Interest

Enable Quality indicators in Cognite charts/tools

Related products:Data Quality
  • November 11, 2024
  • 2 replies
  • 42 views
Øystein Aspøy
  • Øystein Aspøy
    Øystein Aspøy

Øystein Aspøy
Committed

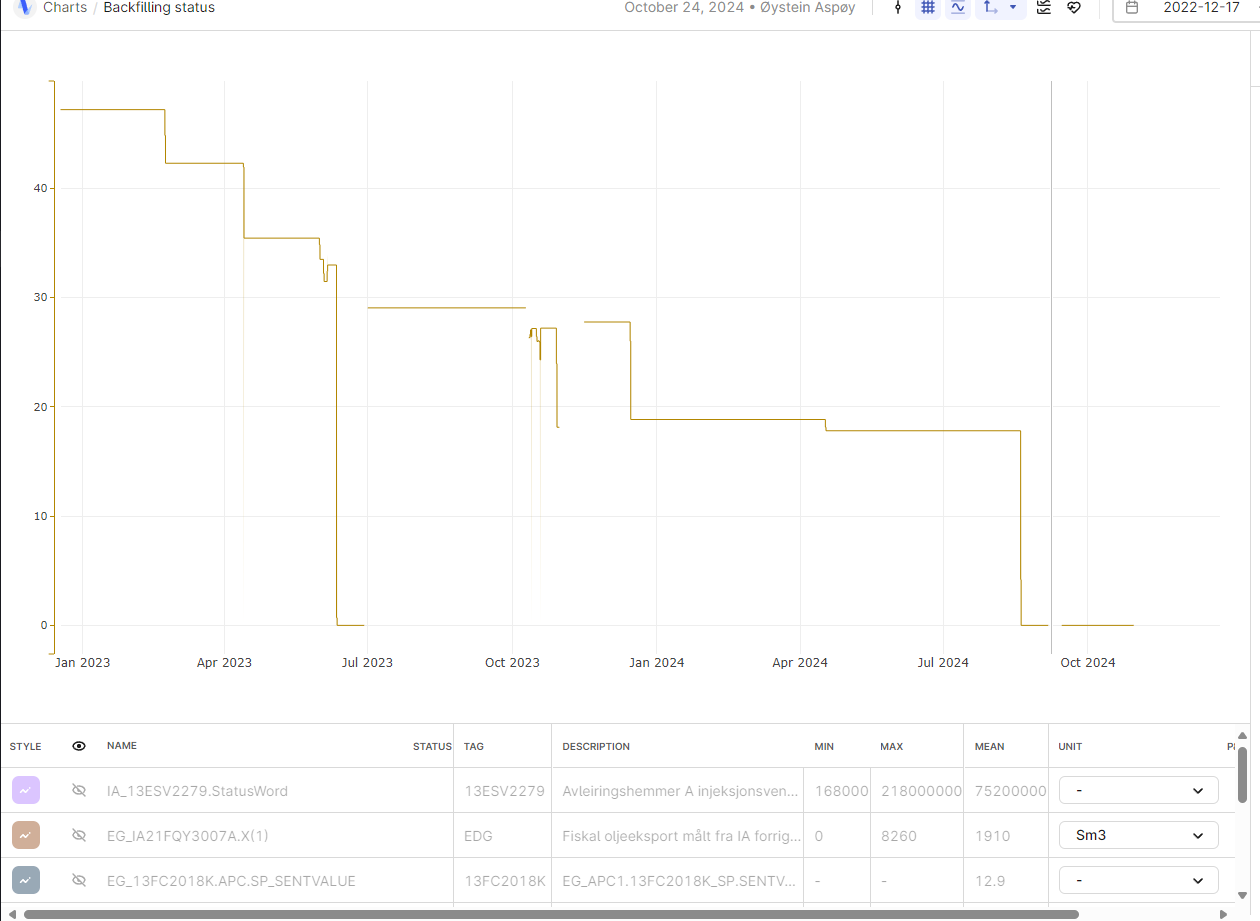
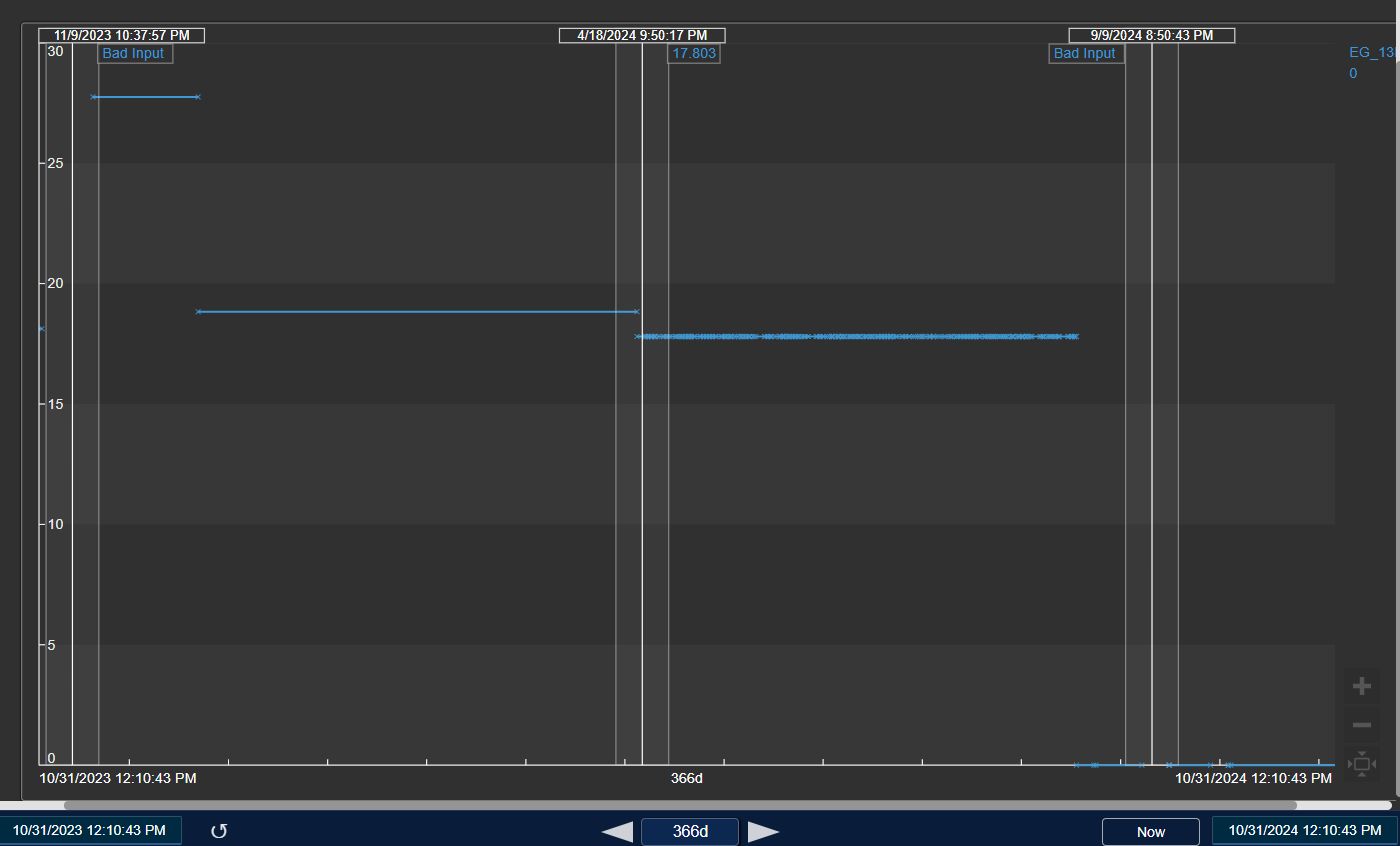
We need the Quality indicators (data point states) in the CDF front end tools, charts etc.

Is this something that is available or possible to configure? 

Examples in the screenshots.


2 replies

Arun Arunachalam
Seasoned Practitioner

Hei @Øystein Aspøy  thanks again for reaching out ! This already available today ! So by default all good points are shown. If data is uncertain they are shown with a different shading while bad data points are not shown. This is an example of how this works today in Charts. However you would need to make sure that this information is being injected into your CDF project today.


Øystein Aspøy
Committed
Forum|alt.badge.img+3

Yes but we need to see the “bad” data and all the states in the charts.

If the data is out of range it might be a reason for it (a number that gives the bad data meaning or  message that is important)

Example could be bad state and -9999 which could mean that the meter you are reading data from needs to be calibrated or something else.


Cookie Policy

We use cookies to enhance and personalize your experience. If you accept you agree to our full cookie policy. Learn more about our cookies.

 
Cookie Settings