Gathering Interest

Charts: "Status Flag Filter" function improvements

Related products:Charts
  • November 12, 2024
  • 5 replies
  • 60 views

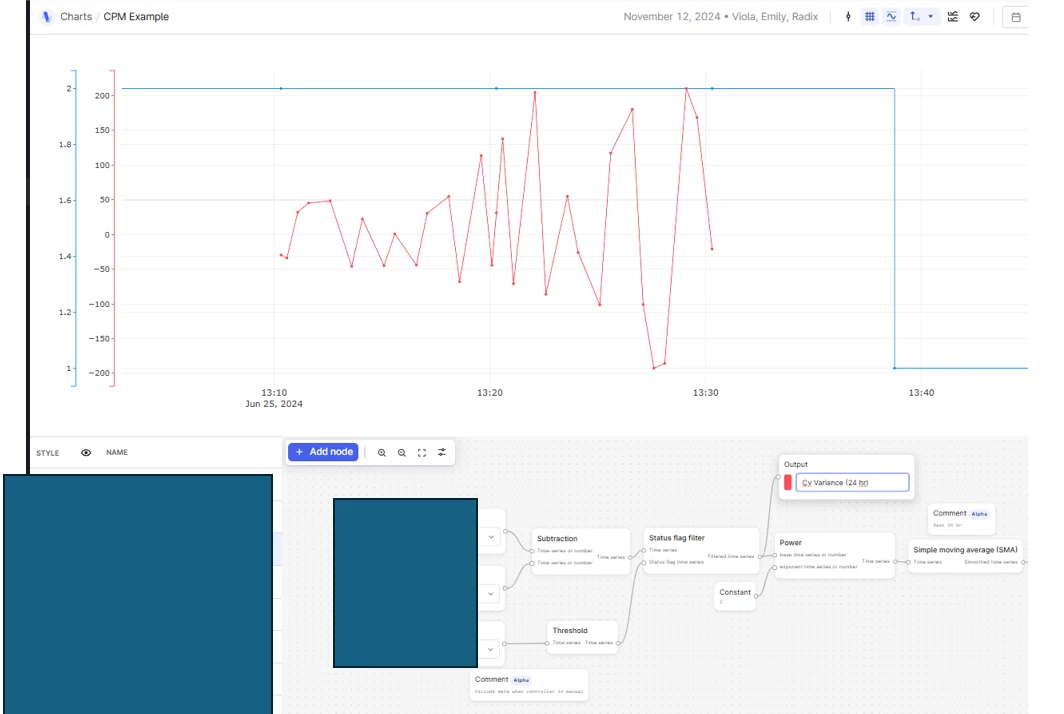
If the status flag timeseries has fewer data points than the main timeseries, it prematurely cuts off the calculated timeseries. Can you make the output of the status flag filter stop producing results only when the status flag actually turns off?

Without status flag filter function (for reference):

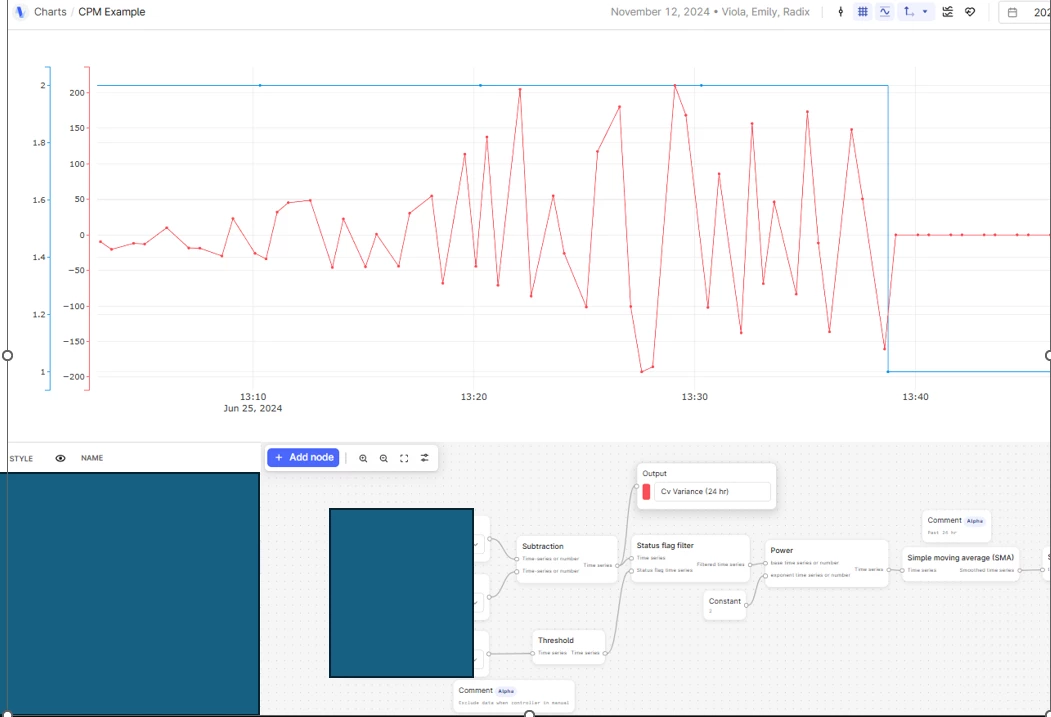
With status flag filter, output stops prematurely:


5 replies

Glen Sykes
Seasoned Practitioner
  • Seasoned Practitioner
  • November 13, 2024

Hi Emily, 

Is the status flag time series you’re describing a representation of a system / machine state. i.e. a valve that is either open or closed is represented as a 1 or a 0?

Kind Regards, Glen


Hi Emily, 

Thanks for reporting this. 

It seems that this is happening due to the current implementation taking into account only the timestamps where status flag is true, but not the two edges when status flag is defined as false. 

I will report this improvement to the team :) 


I want also to let you know that the algorithm is defined in our open source industrial data science library. Any contributions to it are welcome as well.  

Best regards, 

Neringa


  • Author
  • Committed
  • November 14, 2024

Hi Emily, 

Is the status flag time series you’re describing a representation of a system / machine state. i.e. a valve that is either open or closed is represented as a 1 or a 0?

Kind Regards, Glen

Glen, it’s actually a calculated value coming out of the “threshold” calculation block. A value of 1 represents the controller being in auto or cascade, and a value of 0 represents the controller being in manual. 


Glen Sykes
Seasoned Practitioner
  • Seasoned Practitioner
  • November 15, 2024

OK gotcha.

My reason for asking is that we are working on development of a new time series type, which we’re planning to call ‘state’.  Think of it as similar to the ‘digital’ type from PI if you’re familiar with that.  Looking at Q1 2025 time frame for the API updates.  Charts plot behaviour would come later.

By storing data points that represent the state of a system in this new type, you will benefit from some different behaviours such as automatically carrying forward the latest data point value, aggregation queries for the duration of each state, count of state transitions in a time period, and return the state value at a specific point in time.

Would these features be valuable to you in your use case?


Hi Emily, 

I had another look at this problem. The output from threshold function (blue) seems to have a different frequency than the other input time series (red)

In order to achieve the result that you want, you should add a resample to granularity function with a higher frequency and use StepInterpolation as aggregation method to the output of a threshold function. Then you can pass resampled threshold values to the status flag filter. Let me know if this helps! :)