Check the
documentation
Check the
documentation Ask the
Community
Ask the
Community Take a look
at
Academy
Take a look
at
Academy Cognite
Status
Page
Cognite
Status
Page Contact
Cognite Support
Contact
Cognite Support


Hello,
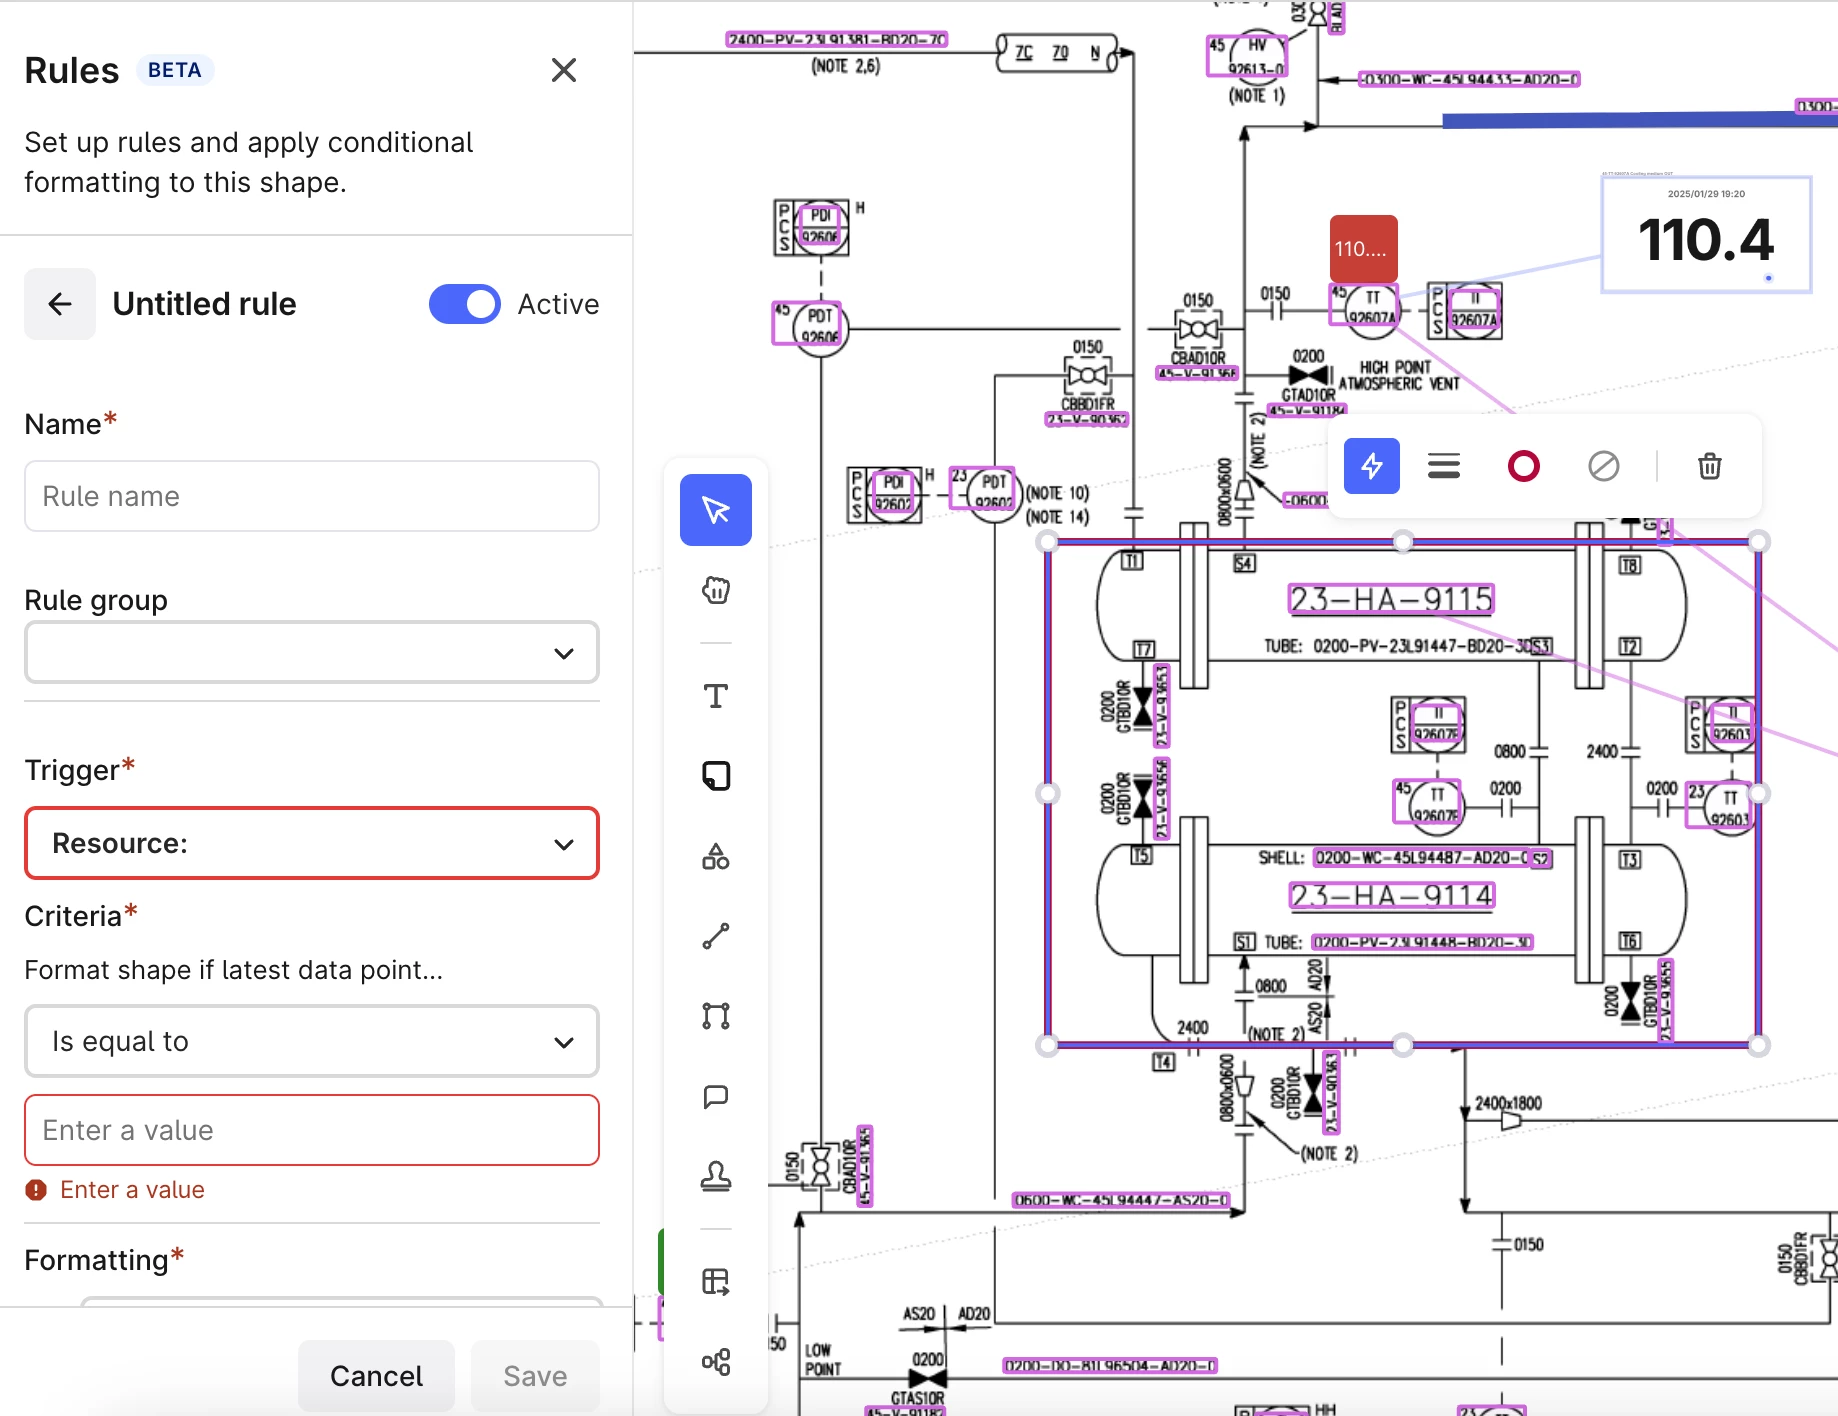
It would be neat if conditional formatting could be applied to shapes on a canvas.
For example, when using a rectangle shape as a visual container around various charts on a canvas - I’d like to be able to dynamically change the background color of the rectangle (when a calculated value drops below a threshold). For example, set the background shape color to red when our calculated OEE value drops below an acceptable limit - set the background shape color back to green when we are back into acceptable limits.
Thanks!