

 Check the
documentation
Check the
documentation Ask the
Community
Ask the
Community Take a look
at
Academy
Take a look
at
Academy Cognite
Status
Page
Cognite
Status
Page Contact
Cognite Support
Contact
Cognite Support

1. Why x-request-id matters
Every CDF API request has a unique x-request-id returned in the response headers. Including this id in your logs allows Cognite (or internal platform teams) to trace the exact backend call in observability tools and Kubernetes logs when investigating issues.
For CDF Functions written with the Python SDK, there are two main ways to surface the x-request-id in function logs:
-
On failed SDK calls (via
CogniteAPIError) => Exceptions — cognite-sdk 7.91.1 documentation -
For all calls (temporarily, via SDK debug logging)
2. Log x-request-id on failed SDK calls
When a Cognite API call fails, the Python SDK raises CogniteAPIError. This exception includes the request id as e.x_request_id.[Exceptions]
Use this pattern in CDF Functions:
from cognite.client.data_classes.data_modeling import ViewId
from cognite.client.exceptions import CogniteAPIError
from datetime import datetime as dt

def handle(client, data):
    try:
        view = ViewId(space="APM_Config", external_id="APM_Config", version="1")
        output = client.data_modeling.instances.list(sources=view)
        print(output)

        # ...your normal logic...

        return {"status": "ok"}

    except CogniteAPIError as e:
        # Logs x-request-id for failed CDF calls
        print(
            f"CDF API error: {e} | x-request-id: {e.x_request_id} | at {dt.now()}"
        )
        # Re-raise so the function call is marked as failed
        raise

    except Exception as e:
        # Non-Cognite errors won’t have x-request-id
        print(f"Non-CDF exception: {e} | at {dt.now()}")
        raise
Everything printed here will appear in the Function “View logs” in Fusion. This pattern is already used in support investigations to capture x-request-id from Functions.
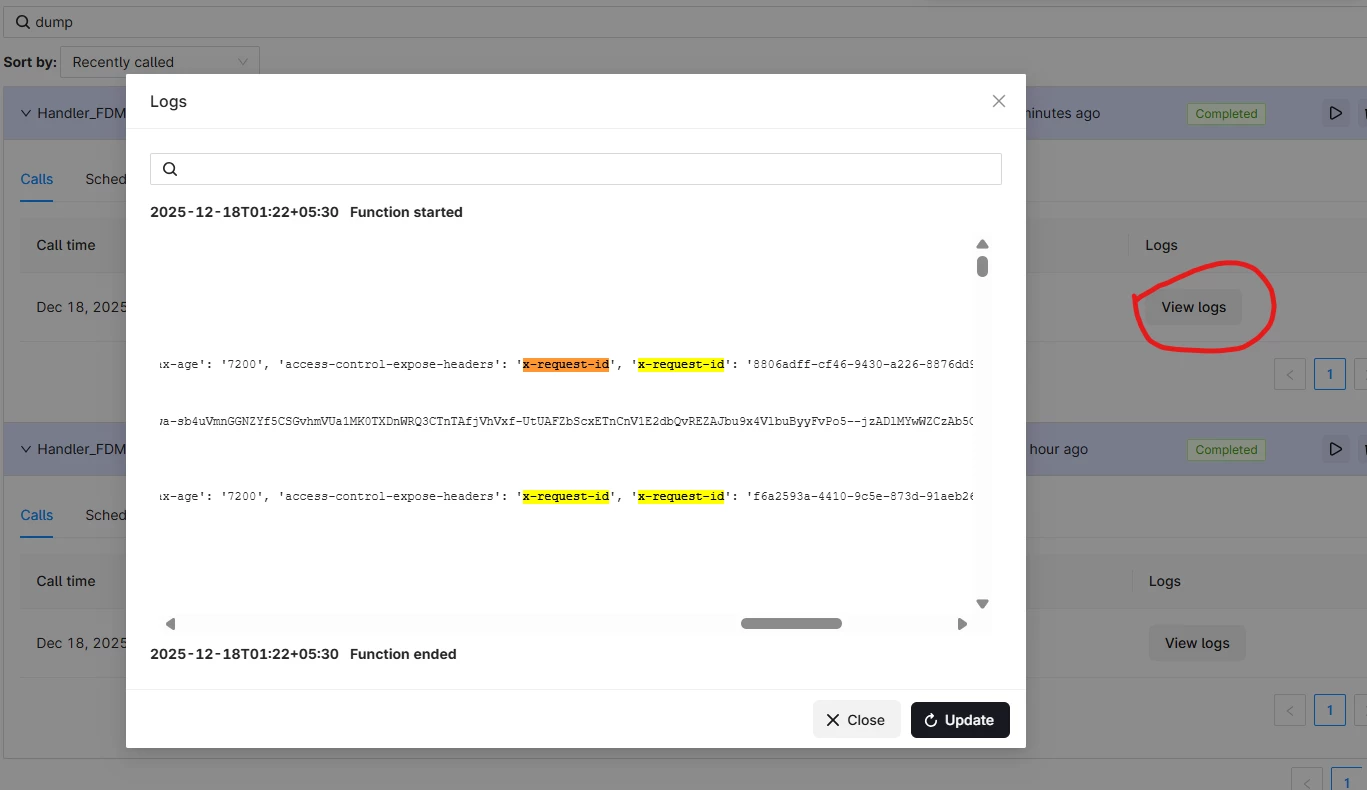
3. Enable debug logging to see x-request-id for successful calls
For successful calls there is no public attribute on the return object exposing x-request-id, but the SDK can log full HTTP debug output (including request id) when debug is enabled on the client config.
In CDF Functions you can temporarily enable this:
from cognite.client.data_classes.data_modeling import ViewId
from cognite.client.exceptions import CogniteAPIError
from datetime import datetime as dt

def handle(client, data):
    # Enable SDK HTTP debug logging for this function invocation
    client.config.debug = True

    try:
        view = ViewId(space="APM_Config", external_id="APM_Config", version="1")
        output = client.data_modeling.instances.list(sources=view)
        print(output)

        # ...your normal logic...

        return {"status": "ok"}

    except CogniteAPIError as e:
        print(
            f"CDF API error: {e} | x-request-id: {e.x_request_id} | at {dt.now()}"
        )
        raise

    except Exception as e:
        print(f"Non-CDF exception: {e} | at {dt.now()}")
        raise
With client.config.debug = True, the SDK prints HTTP request/response details (including x-request-id) to stdout, which shows up in function logs.
Best practice
-
Use debug logging only for troubleshooting; it is verbose.
-
Turn it off again when you no longer need detailed traces.
4. Pattern used in extractors (for reference)
For CDF extractors (OPC UA, PI, PIAF), sdk-logging can be configured to always log ResponseHeader[X-Request-ID]:
cognite:
  sdk-logging:
    disable: false
    level: debug
    format: "CDF ({Message}): {HttpMethod} {Url} {ResponseHeader[X-Request-ID]} - {Elapsed} ms"
This shows a supported pattern for automatically surfacing x-request-id in logs for SDK-based integrations.[OPC UA sdk-logging; PI sdk-logging]