Solved

Need to co-relate Events with Timeseries


Userlevel 1
Badge +1

HI All,


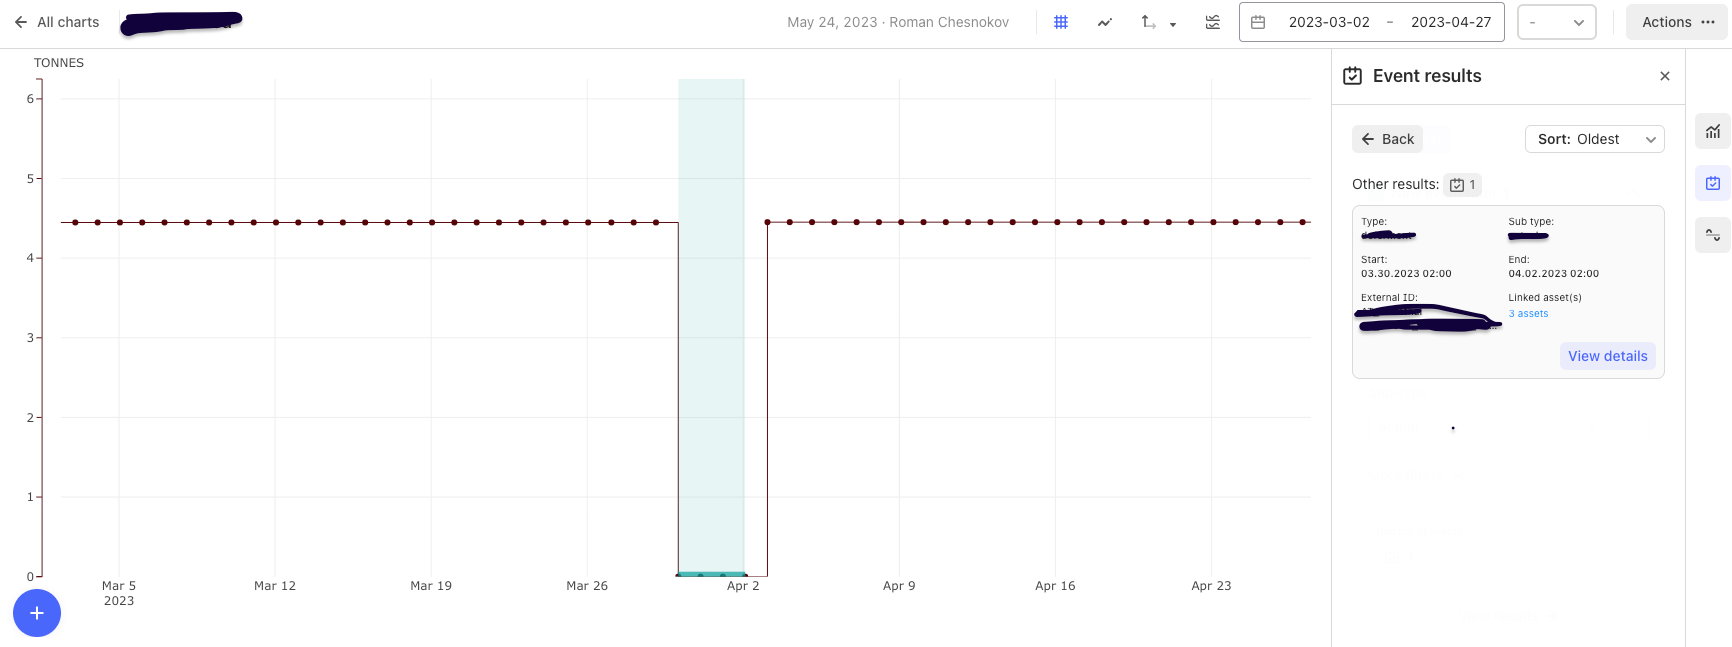
I am looking to help in order to display timeseries and events co-relation in Power BI. I want to show when the event occurred in timeseries chart on specific event time.

Any inputs would be appreciated!


Regards,

Arati 

icon

Best answer by Ankit Kumar 2 June 2023, 12:33

View original

11 replies

Userlevel 4
Badge +2

Hi @Paramale Arati,

I hope you were able to solve the issue. As of now, I will close this thread. If you have any questions please feel free to reach out to us. 

Best regards,
Dilini  

Userlevel 2
Badge

Hi, Hope we have clarified on the solution here .

We have discussed the available options and identified the best-suited solution for your needs. I have provided all the necessary information and insights to ensure a clear understanding of the proposed approach.

If you have any additional questions or require further clarification, please don't hesitate to reach out

Userlevel 1
Badge +1

HI @Ankit Kumar, As discussed, please let me know if you have any further inputs. 

Thanks in advance!

Userlevel 3

@Paramale Arati It's important to note that in the event you have both a start and end date, so it cannot be displayed as a point marker. So, as @Ankit Kumar  wrote before, you can’t directly display both timeseries and events in one chart in PowerBI. But it allows you to utilise a Line chart along with a custom timeline chart, such as a Gantt chart, for example, one under another, and apply the same filters on intervals. This method can be effective if there are not too many events within the observed interval.

And that’s an example of how it looks like in Cognite Charts:


Userlevel 1
Badge +1

Do you mean we cant plot TS and events association in one chart in PowerBI? I can connect tomorrow anytime post 2PM IST tomorrow.

Userlevel 2
Badge

I see, the kind of feature you are looking for is not supported in Power Bi, but we very well support this in Charts today. Please let me know what time time you are available tomorrow and we can setup a call to demo that.


Userlevel 1
Badge +1

Sure Ankit. I have Timeseries plotted in Line chart (x-axis: timestamp of TS and y axis: temperature/pressure measure) and i want to show when event has occurred in same chart by plotting a marker for event name. 

Userlevel 2
Badge

sure...it will be good if you can describe the issue before in details which gives me more time to prepare and discuss on possible solutions.


Userlevel 1
Badge +1

@Ankit Kumar Thank you Ankit for your inputs! Can we have working session so that i can discuss in detail?

Userlevel 2
Badge

Events are associated with Assets. You will have Asset Id field in Events table which you can link with Assets table. The Assets and Timeseries table has one-many relationship already

Userlevel 1
Badge +1

HI Team, 

Any inputs would be appreciated!

Thanks in advance!

Regards,

Arati

Reply