Check the
documentation
Check the
documentation Ask the
Community
Ask the
Community Take a look
at
Academy
Take a look
at
Academy Cognite
Status
Page
Cognite
Status
Page Contact
Cognite Support
Contact
Cognite Support
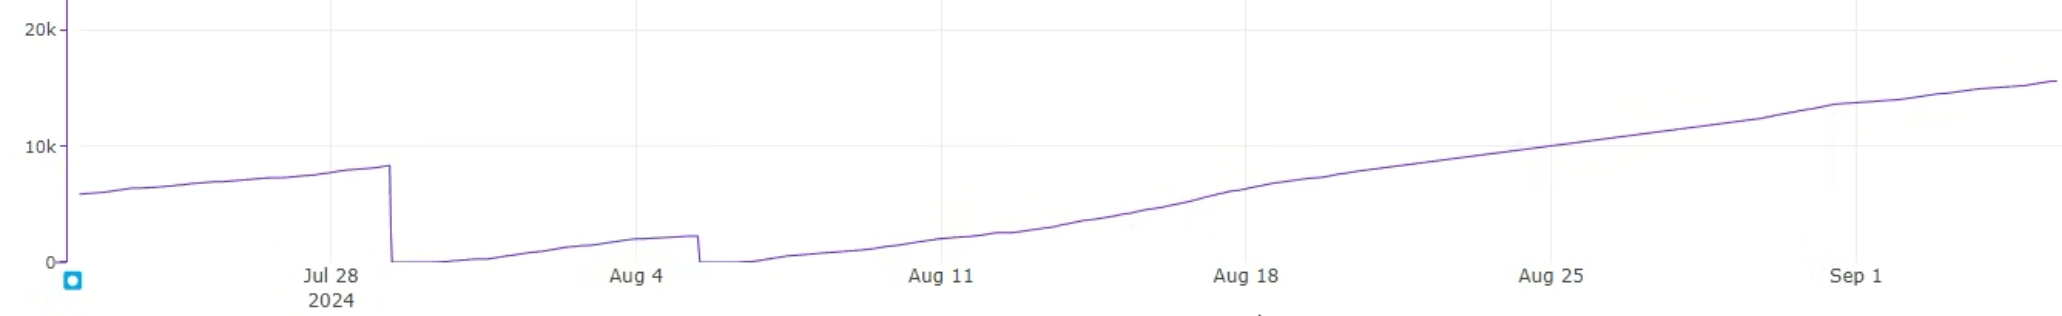
Let’s say I have a time series with the behavior seen above. This is a tag that represents the water consumption in my house (it’s a hypothetical).
Occasionally I manually reset the sensor measuring it and it goes back to zero as you can see in the curve, but otherwise this sensor works more or less like your water meter: it measures the total volume of water consumed since the beginning of times until the meter reaches 999,999 and it resets itself to 000,000 automatically
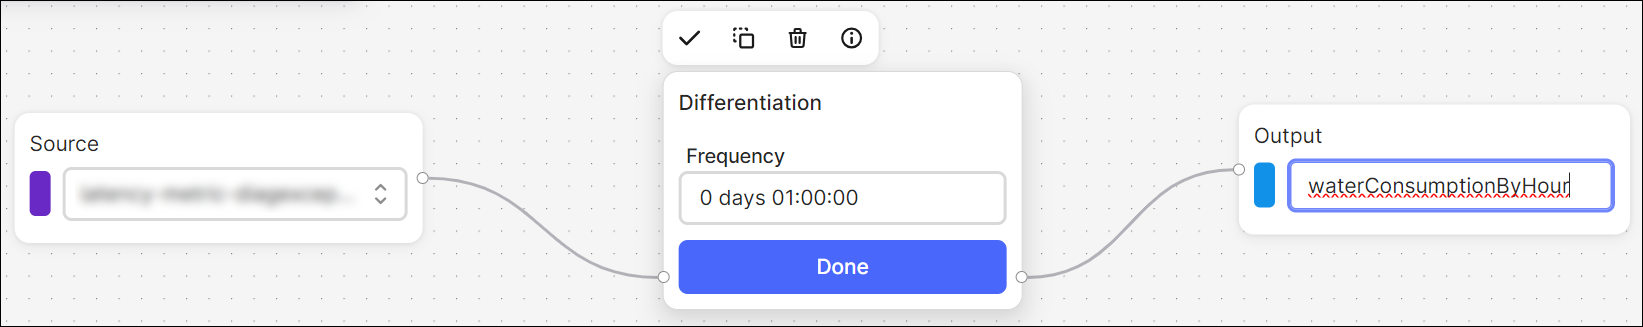
How do I implement a scheduled calculation in Charts that will compute the hourly water consumption at my house? I want to start calculating this at 00:30:00 of today, and the calc should run every hour after that (i.e. 01:30:00, 02:30:00, 03:30:00, 04:30:00, etc indefinitely)
Thanks.