I have a set of timeseries objects in CDF. I want to create a chart using SDK based on some function using the base timeseries objects. How Do I do that using SDK
I have a timeseries object with externalID ‘ts-ext1’. I need to create a chart that follows the operation as below.
[141/(ts-ext1) - 131.5 ]
How do I do this in code iteslf?
Best answer by kelvin
As the above comments point out, there’s no SDK for Charts at current time. However, all the Charts calculations are available in Cognite’s industrial data science library, which you could use in combination with for example Cognite Functions.
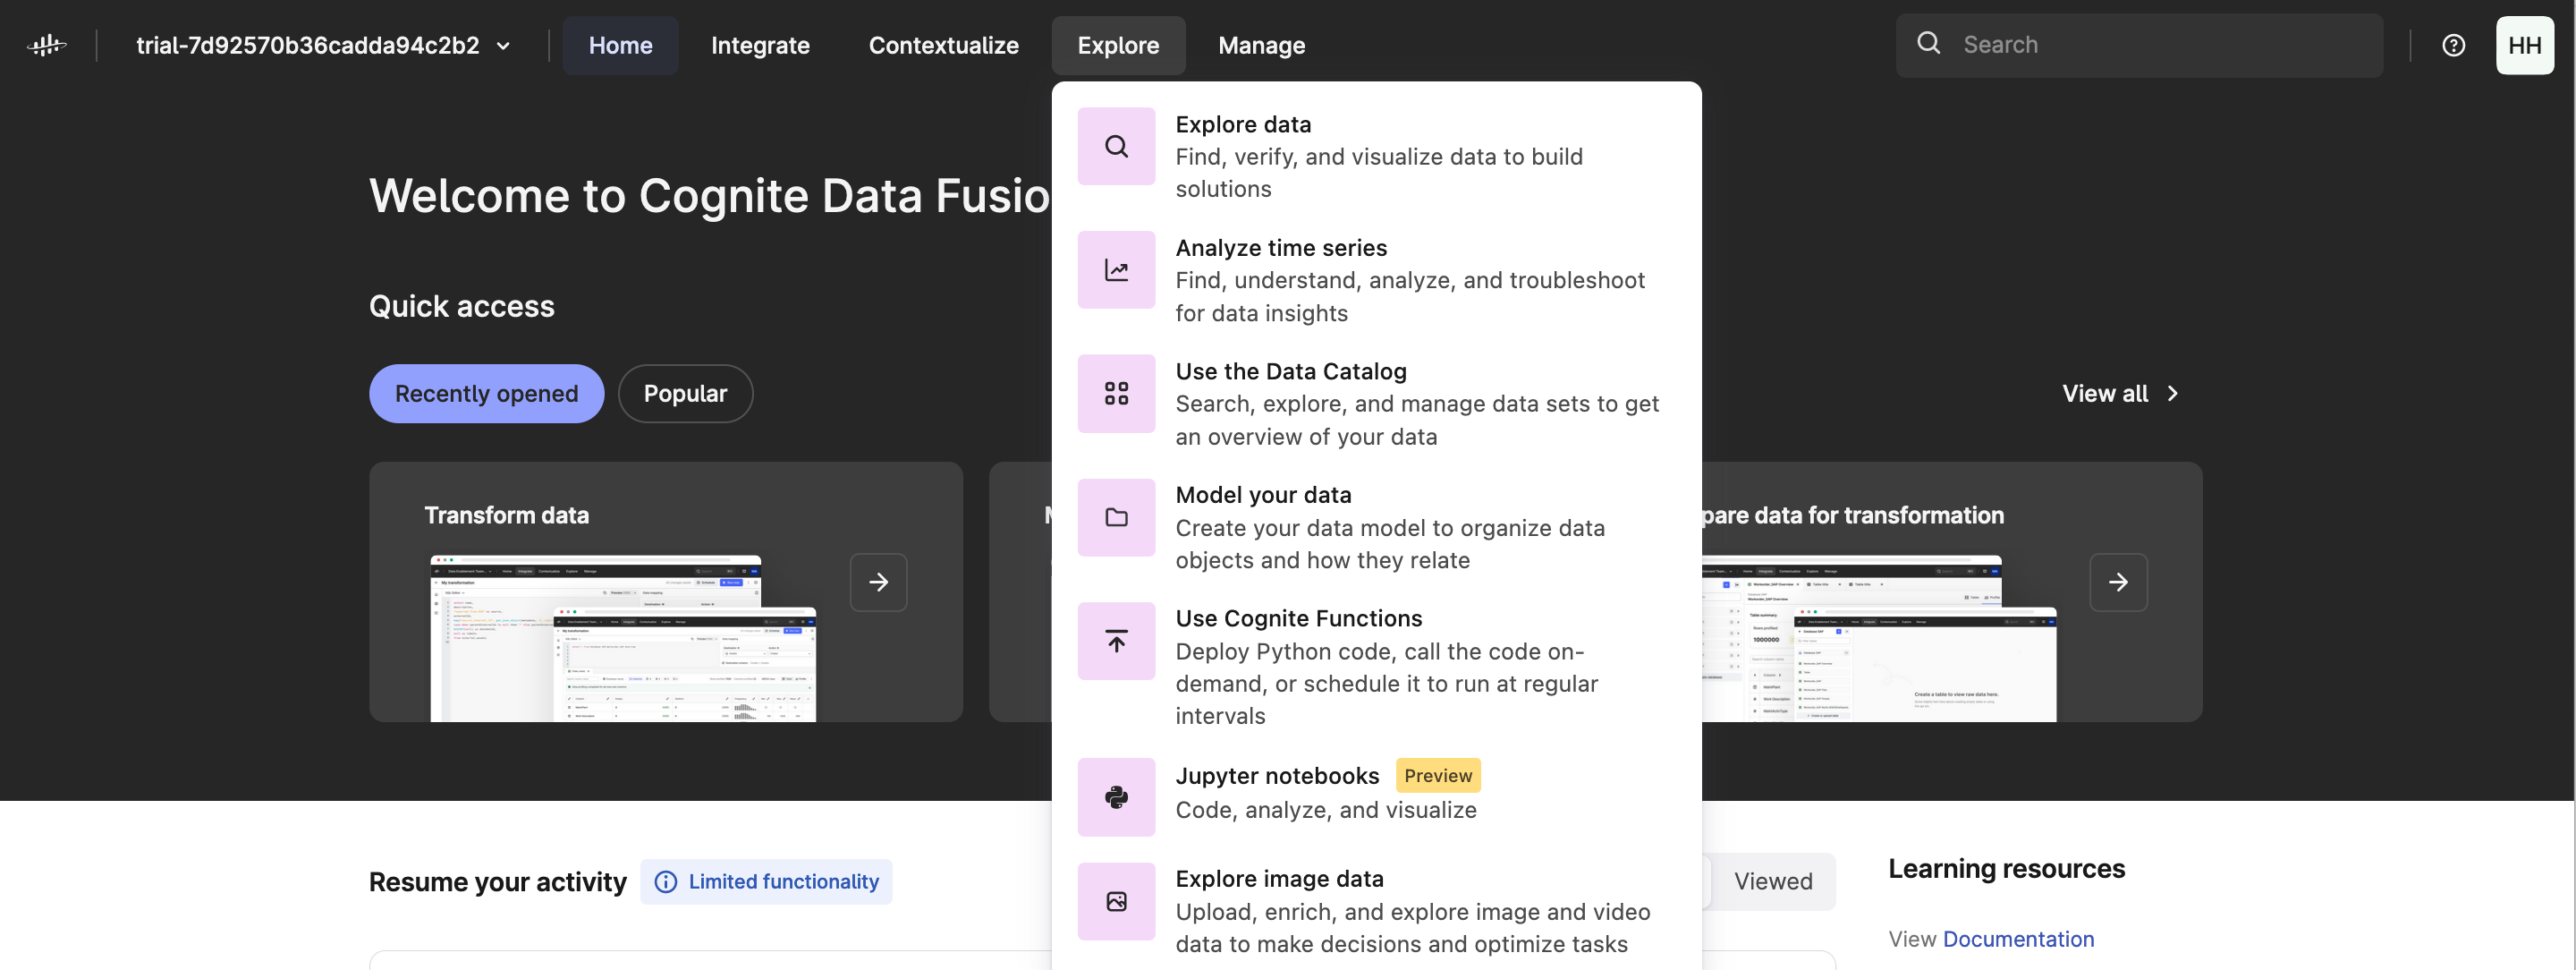
Hi @eashwar11, I don’t know of any way to use the Cognite SDK to create a chart in Cognite Charts but you can do this from the Fusion (web) interface. If you click on Explore in the top menu and then “Analyze time series”, then this will take you to the menu where you can create new charts.
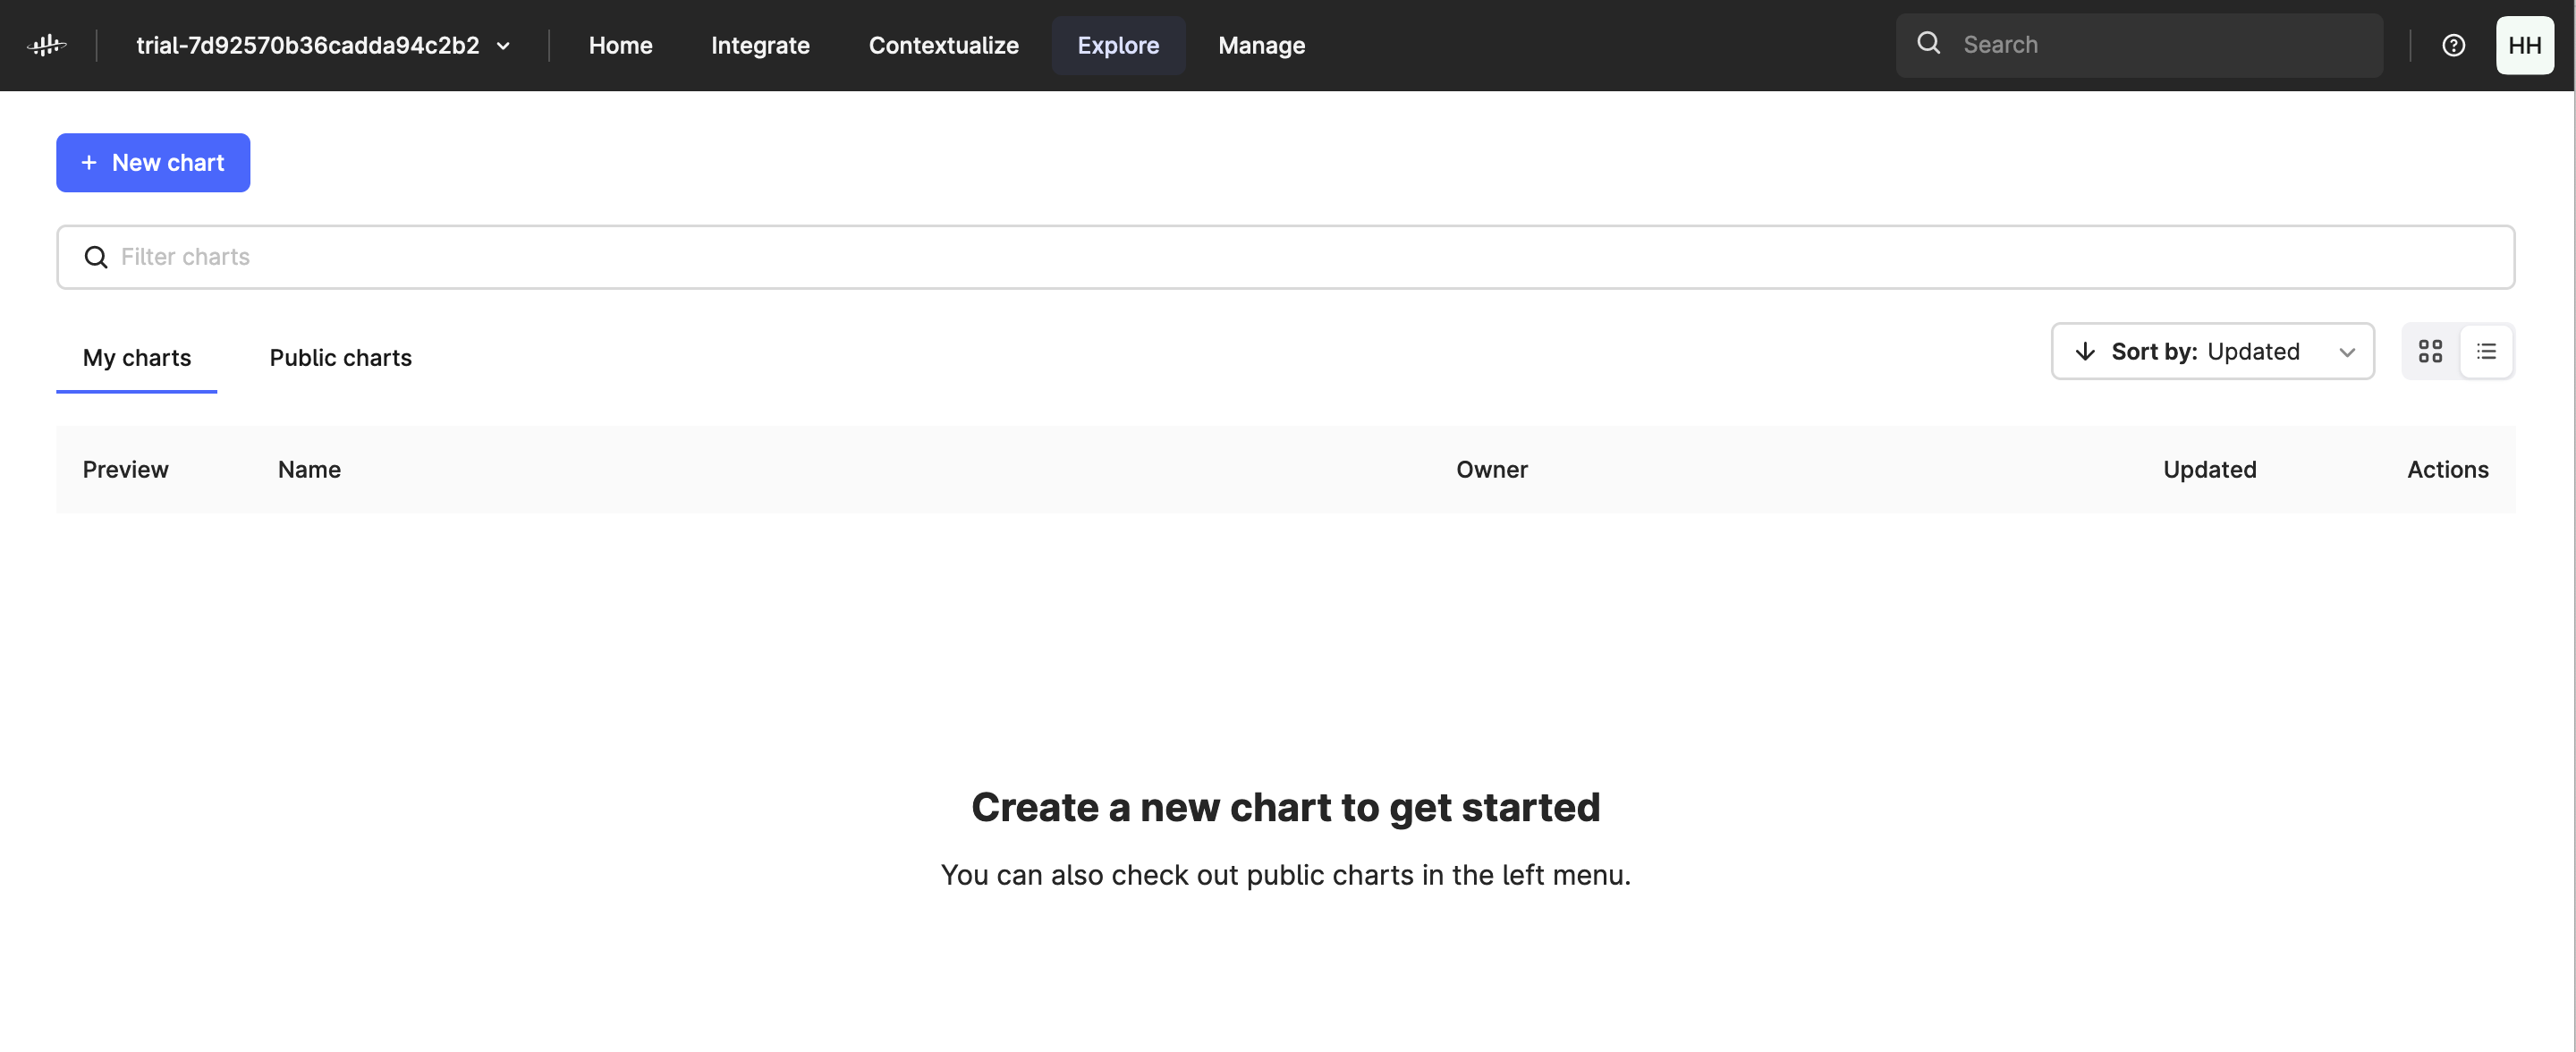
After clicking on that, you should be taken to the following page:
Then you just need to click on the new chart button and you should be on your way to creating new plots in Cognite Charts. Hope that helps!
I have to create around 137 charts using some base timeseries objects. After testing each of the chart, I need to push them into PRODUCTION as well.
So hence I was wondering if there is a way to mechanize this using SDK so that when it's all tested, I can replicate the same setup in different project (environment) as well.
Hi, is this 137 different Charts, or 137 different calculations?
While we do not have SDK functionality to create charts and no-code calculations, two options are either code or no code option.
no code calculations ca be downloaded as JSON file to your computer (top right menu … and download calculation). This JSON file can be uploaded to any chart so you don't have to recreate it. Just assign the right time series in the new chat.
Run the calculations as Python code using Cognite Functions, and automate the calculations. The resulting time series can be opened in Charts.
As the above comments point out, there’s no SDK for Charts at current time. However, all the Charts calculations are available in Cognite’s industrial data science library, which you could use in combination with for example Cognite Functions.
We use 3 different kinds of cookies. You can choose which cookies you want to accept. We need basic cookies to make this site work, therefore these are the minimum you can select. Learn more about our cookies.


 Check the
documentation
Check the
documentation Ask the
Community
Ask the
Community Take a look
at
Academy
Take a look
at
Academy Cognite
Status
Page
Cognite
Status
Page Contact
Cognite Support
Contact
Cognite Support