Check the
documentation
Check the
documentation Ask the
Community
Ask the
Community Take a look
at
Academy
Take a look
at
Academy Cognite
Status
Page
Cognite
Status
Page Contact
Cognite Support
Contact
Cognite Support
Hi! I’m curious what is the best practice to do this basic thing and visualize on Grafana ( ideally without code):
- With a flow transmitter, summarize the total volume per day or week.
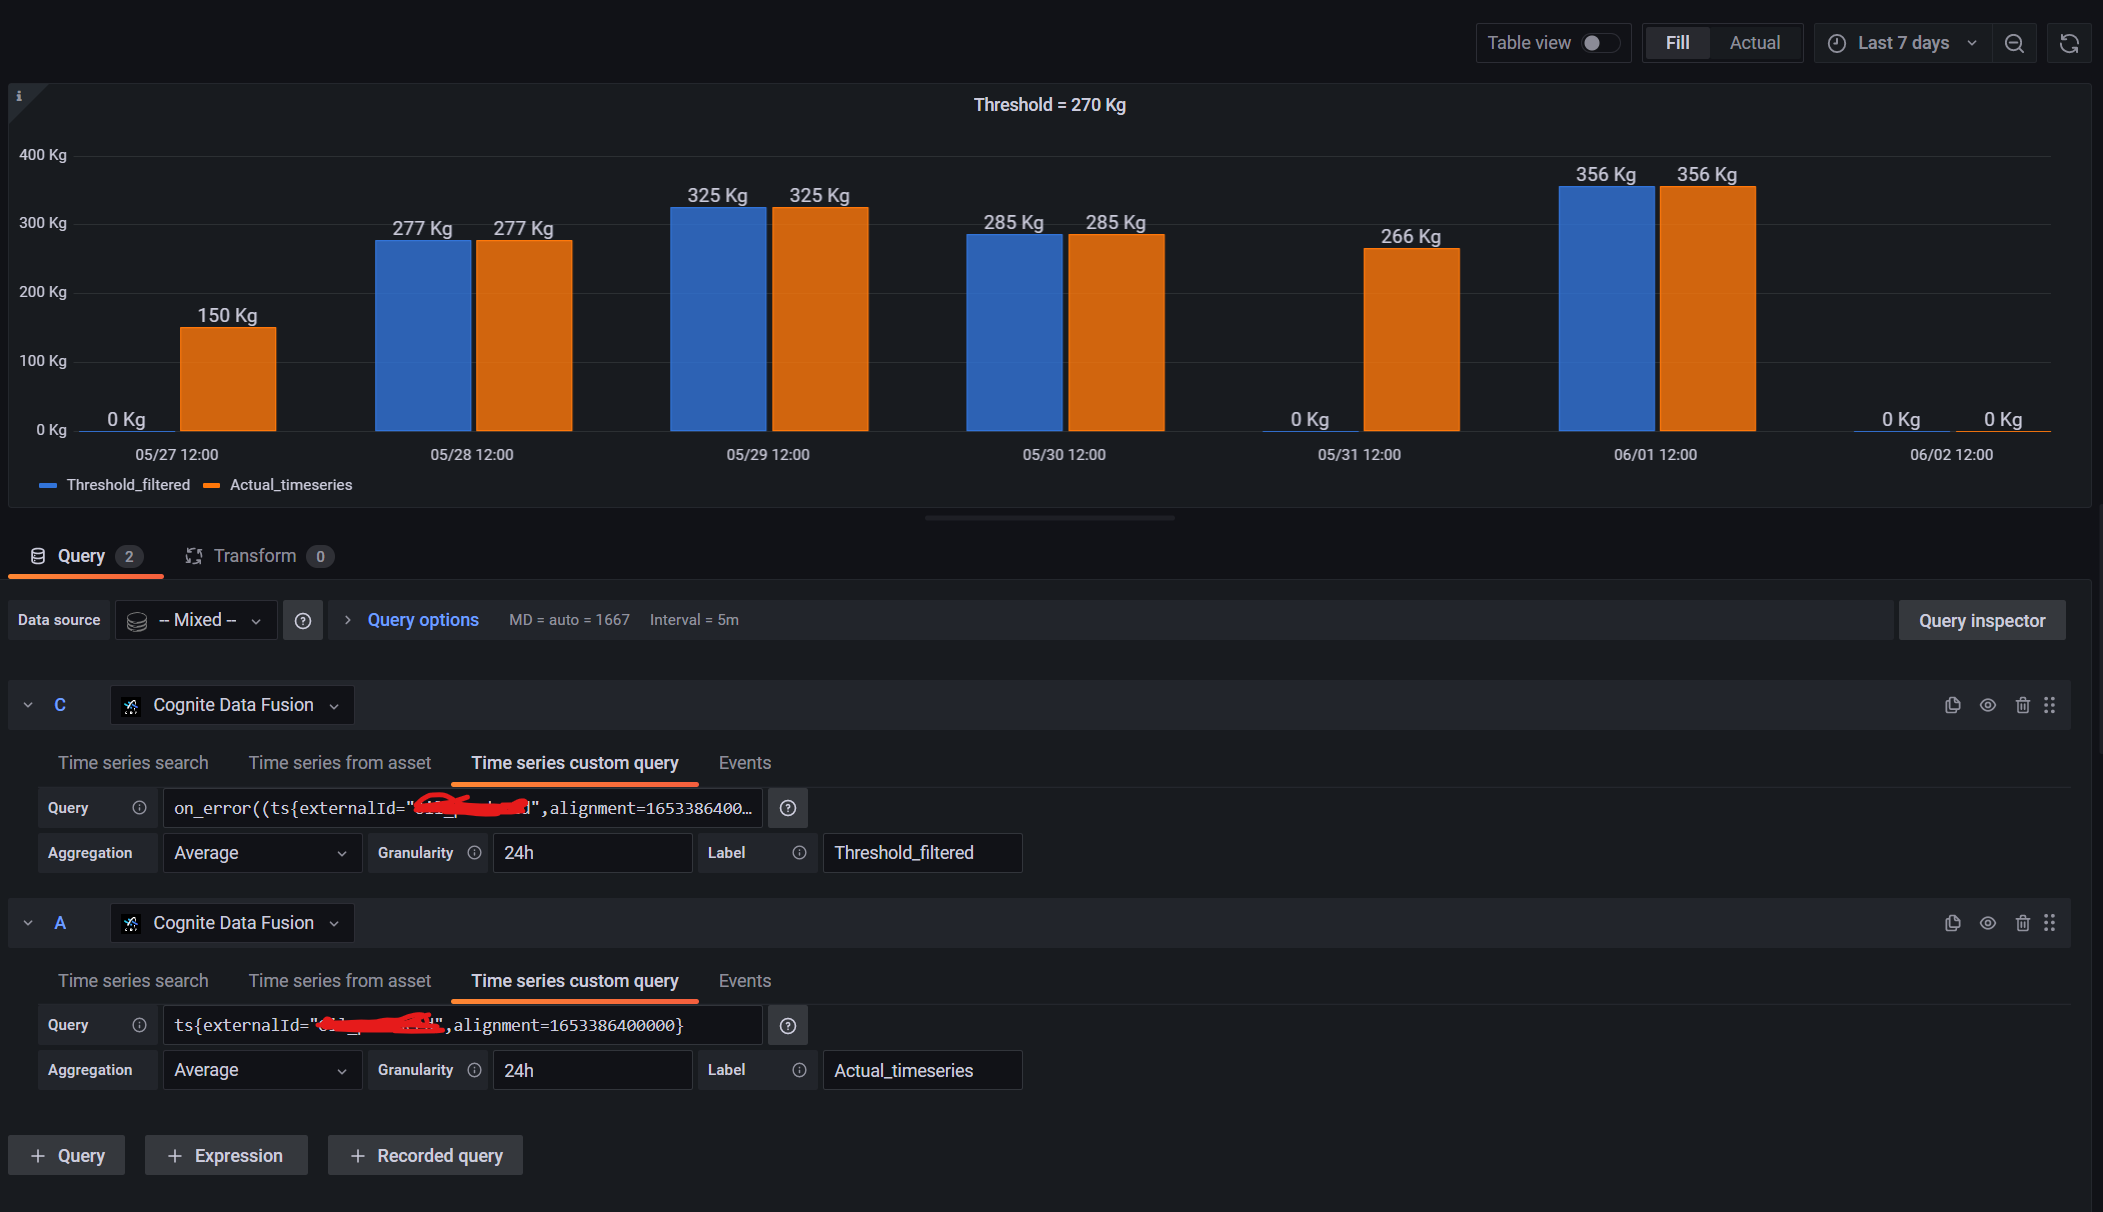
- Correct the above against a threshold or a running signal. Ie. I now when the flow should be 0
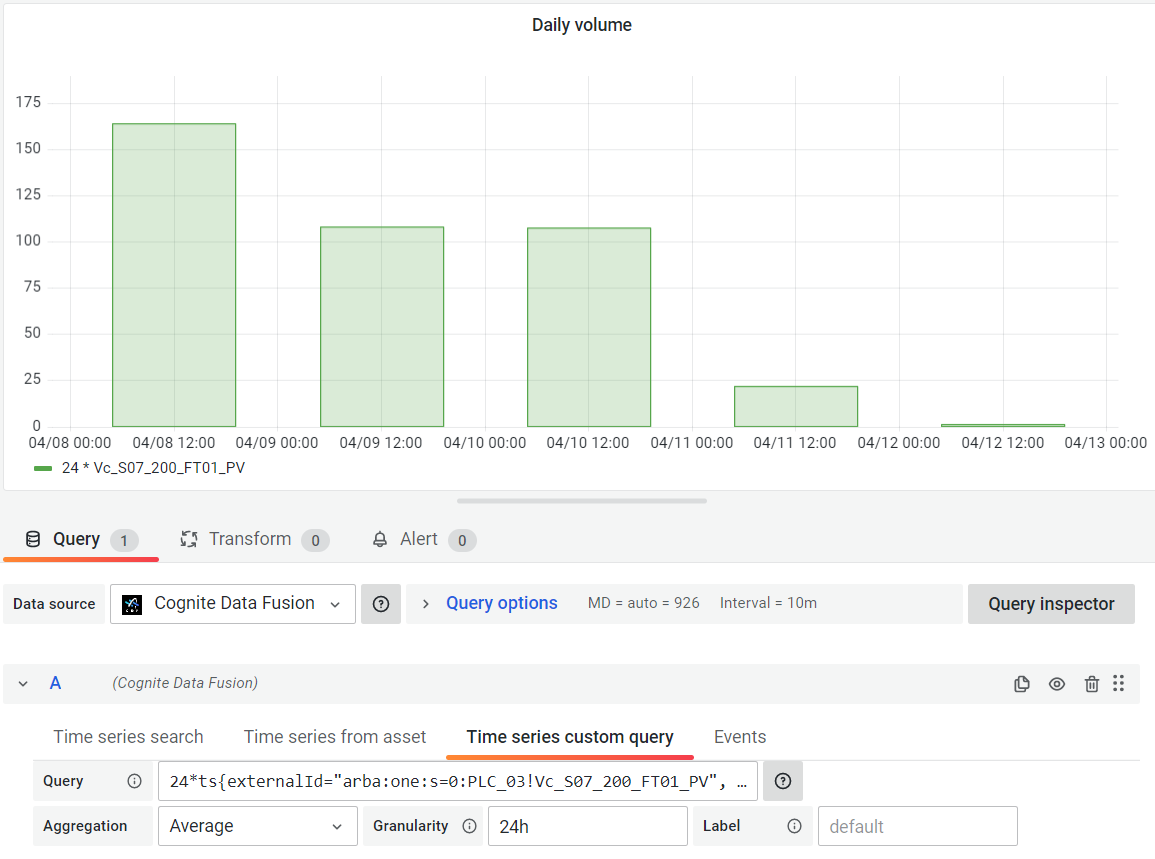
Here’s how I do nr 1, it feels a bit like a hack. Nr2 I am solving with Functions in CDF, however it would be nice if there’s a quick way of doing it without code,
The query looks like this:
24*ts{externalId="arba:one:s=0:PLC_03!Vc_S07_200_FT01_PV", alignment=1653386400000}
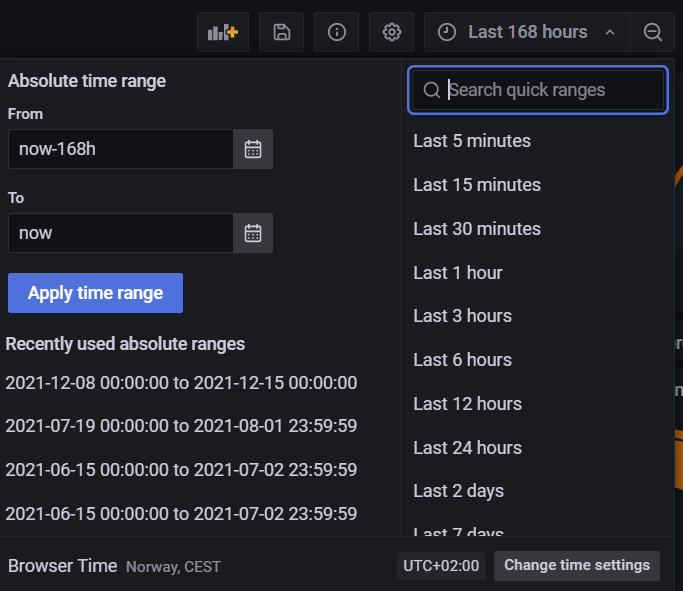
-Should the alignment be at the middle of the day, 12:00, or at midnight 00:00? When we get back to wintertime, it will be off by one hour..