Check the
documentation
Check the
documentation Ask the
Community
Ask the
Community Take a look
at
Academy
Take a look
at
Academy Cognite
Status
Page
Cognite
Status
Page Contact
Cognite Support
Contact
Cognite Support
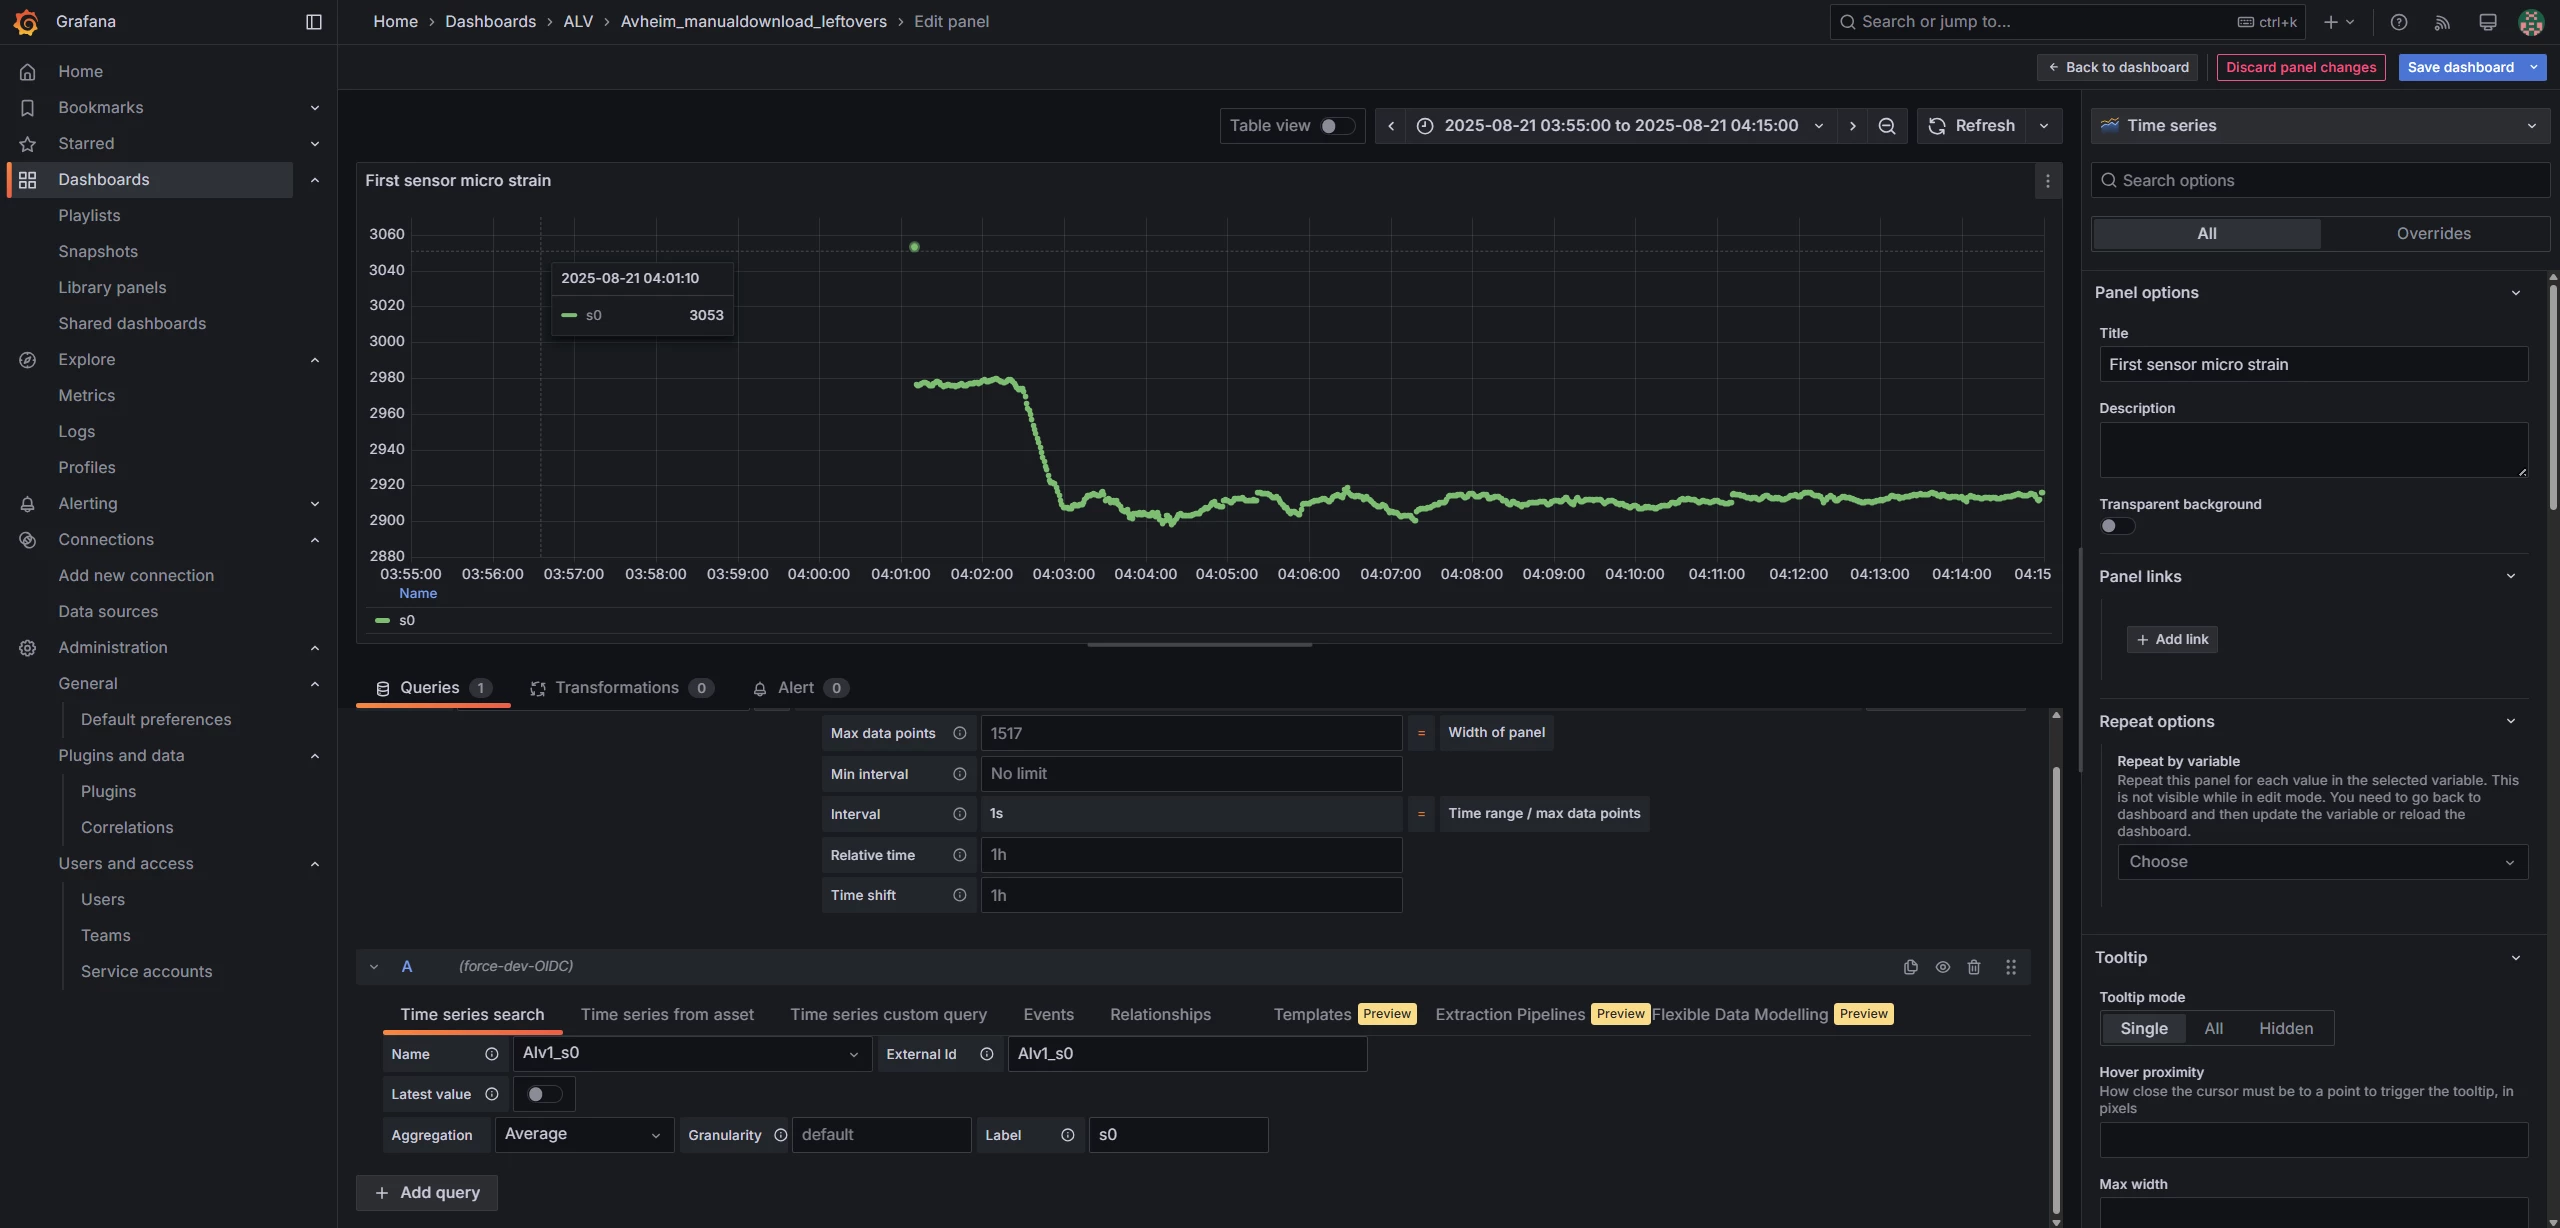
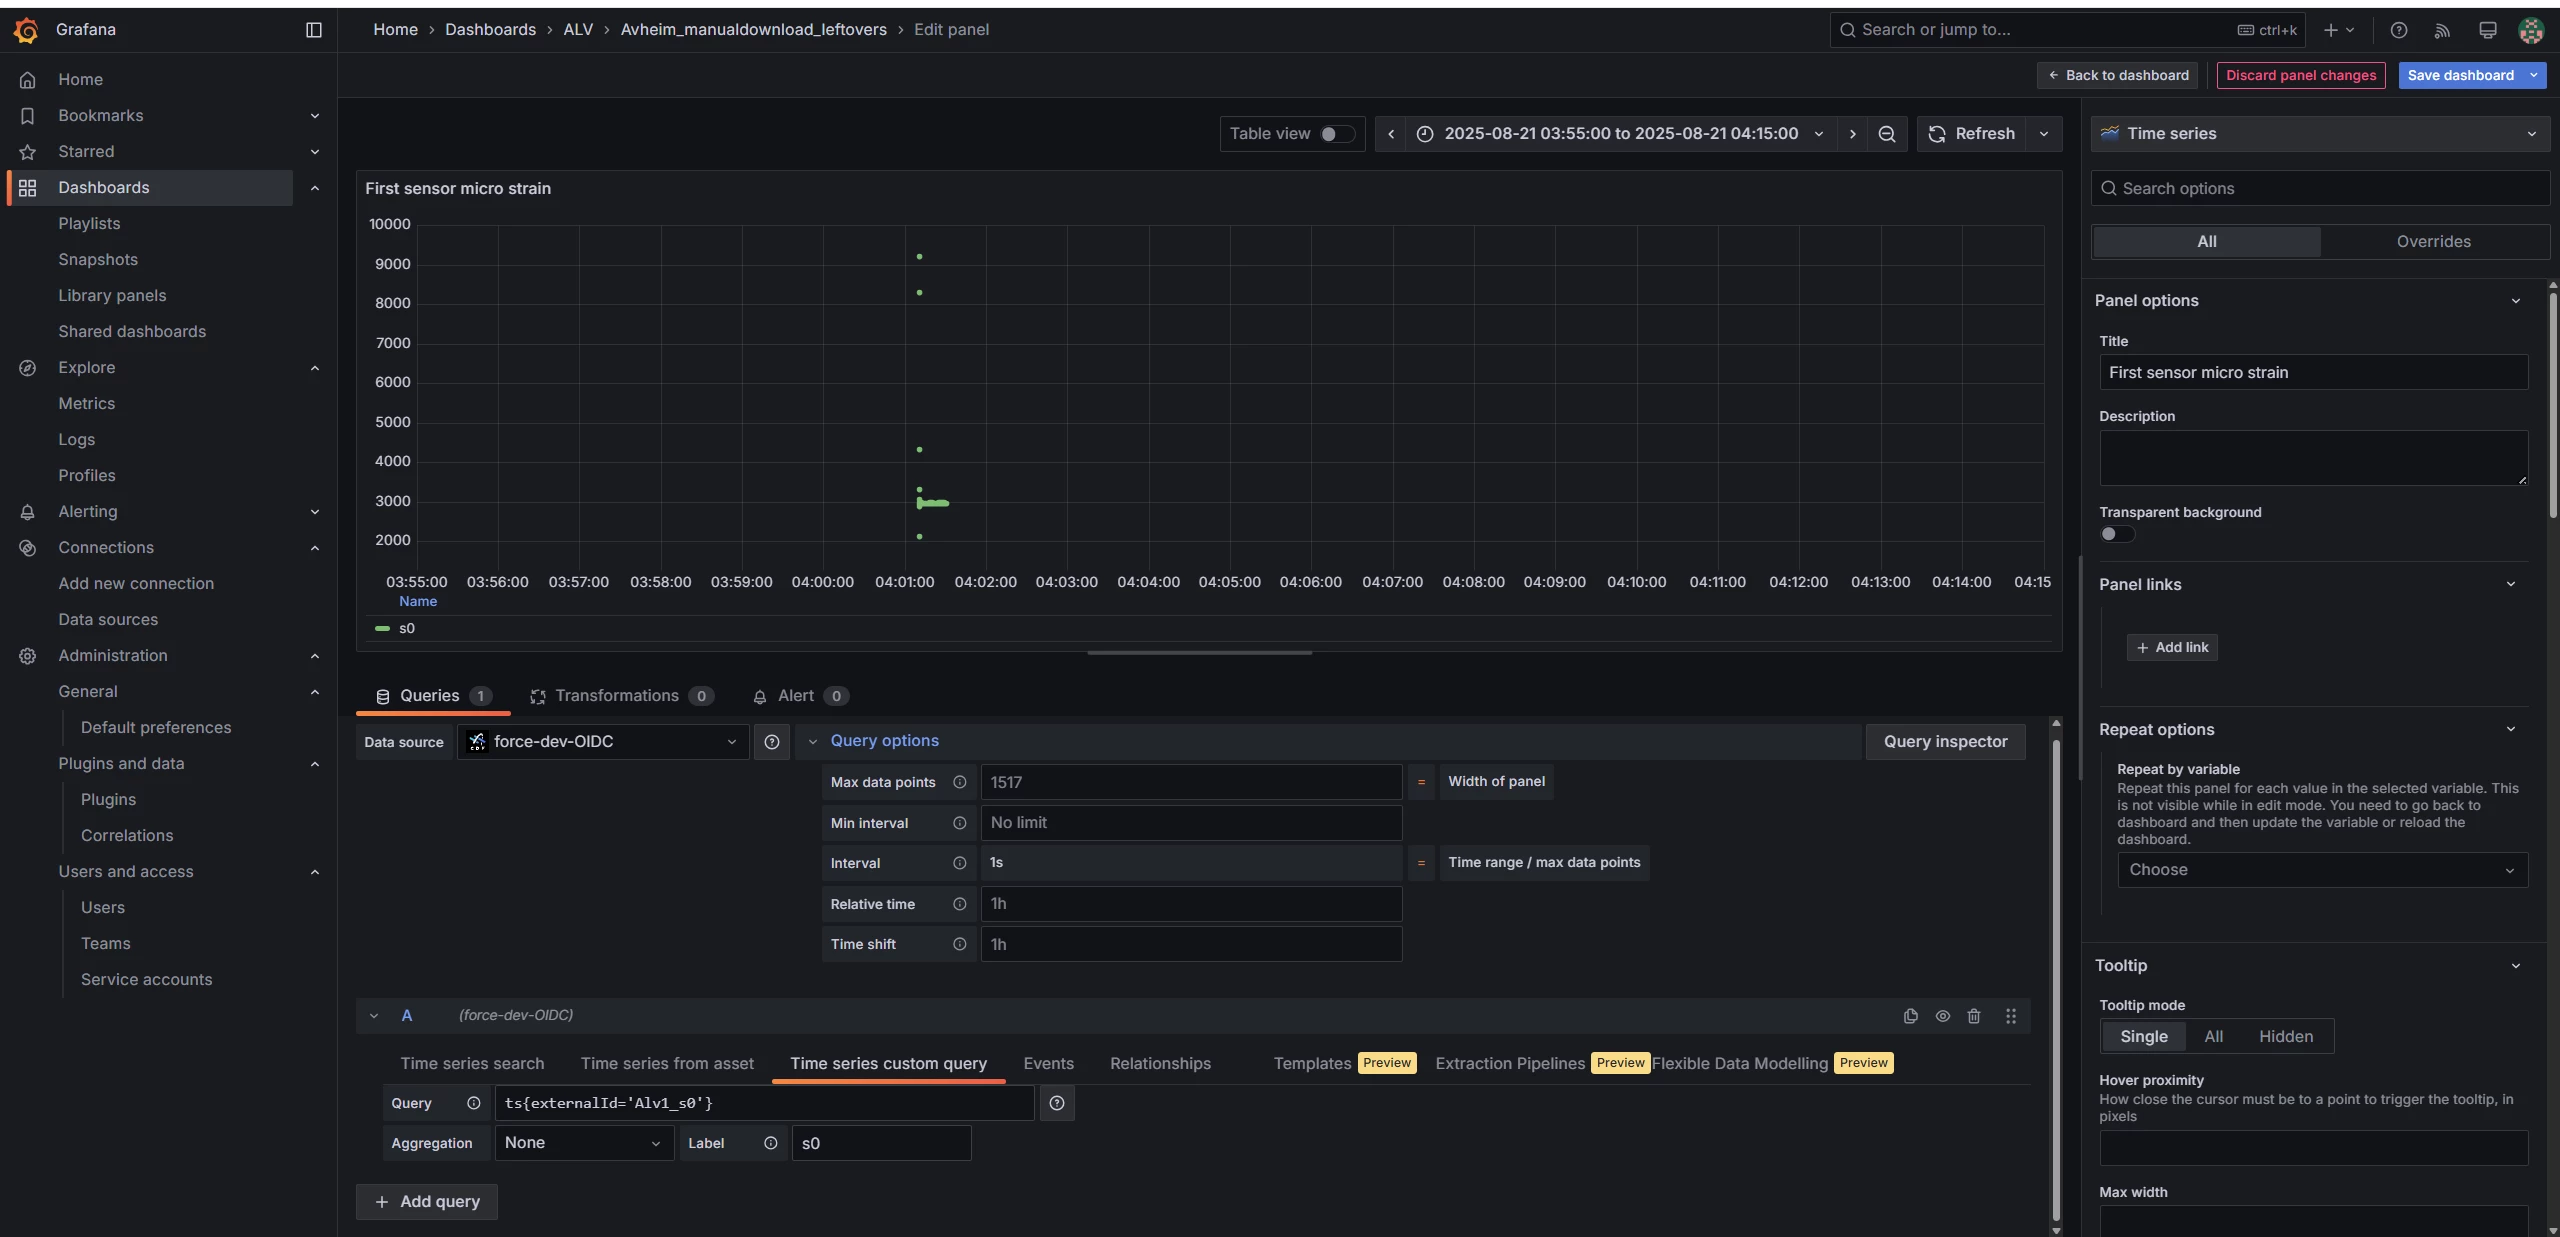
Below I have attached three screeshots where I query same data in same time range. I have used Queries in first screenshot, and it corresponds to original data inspected in Charts, i.e. there is no data before 4:01. This is very basic query using external id. However in many cases we need custome query where we use parametrised syntax. I have used a very basic syntax in the second screenshot that only use external id to query same timeseries as first screenshot. But the result is clearly different, there are datapoints created where there should be no data. Inspecting the datapoints in query, I see real data points with some values are created in no data area! Disabling aggregate resolve problem of creating non exiting data in third screenshot but then it query all datapoints and saturates in 2 seconds (reach max datapoints that grafana can show). So I need aggregated data and I have tried aggregate inside the syntax and same problem in scheenshot2 persists in this case.
Any idea how to overcome this issue?