

 Check the
documentation
Check the
documentation Ask the
Community
Ask the
Community Take a look
at
Academy
Take a look
at
Academy Cognite
Status
Page
Cognite
Status
Page Contact
Cognite Support
Contact
Cognite Support

Data Modeling provides you with the flexibility to define your own Industrial Knowledge Graphs based on relevant industry standards, your organization’s own data structures and use cases, or a combination of all of these. Large, and often complex, Industrial Knowledge Graphs might be needed to represent the full extent of your industrial data across disciplines. An important aspect of these knowledge graphs is being able to explore and iterate on both its data and its structure.
With this release, we are enhancing the Data Modeling user interface in Cognite Data Fusion to better visualize the containers and views of your data model.
Isolate a view or container
You can now isolate a view or container by clicking on an item, and choosing from the Quick Filter at the bottom right corner. You can decide between isolating the view or container by itself, or show all other views and containers related to the current selection.
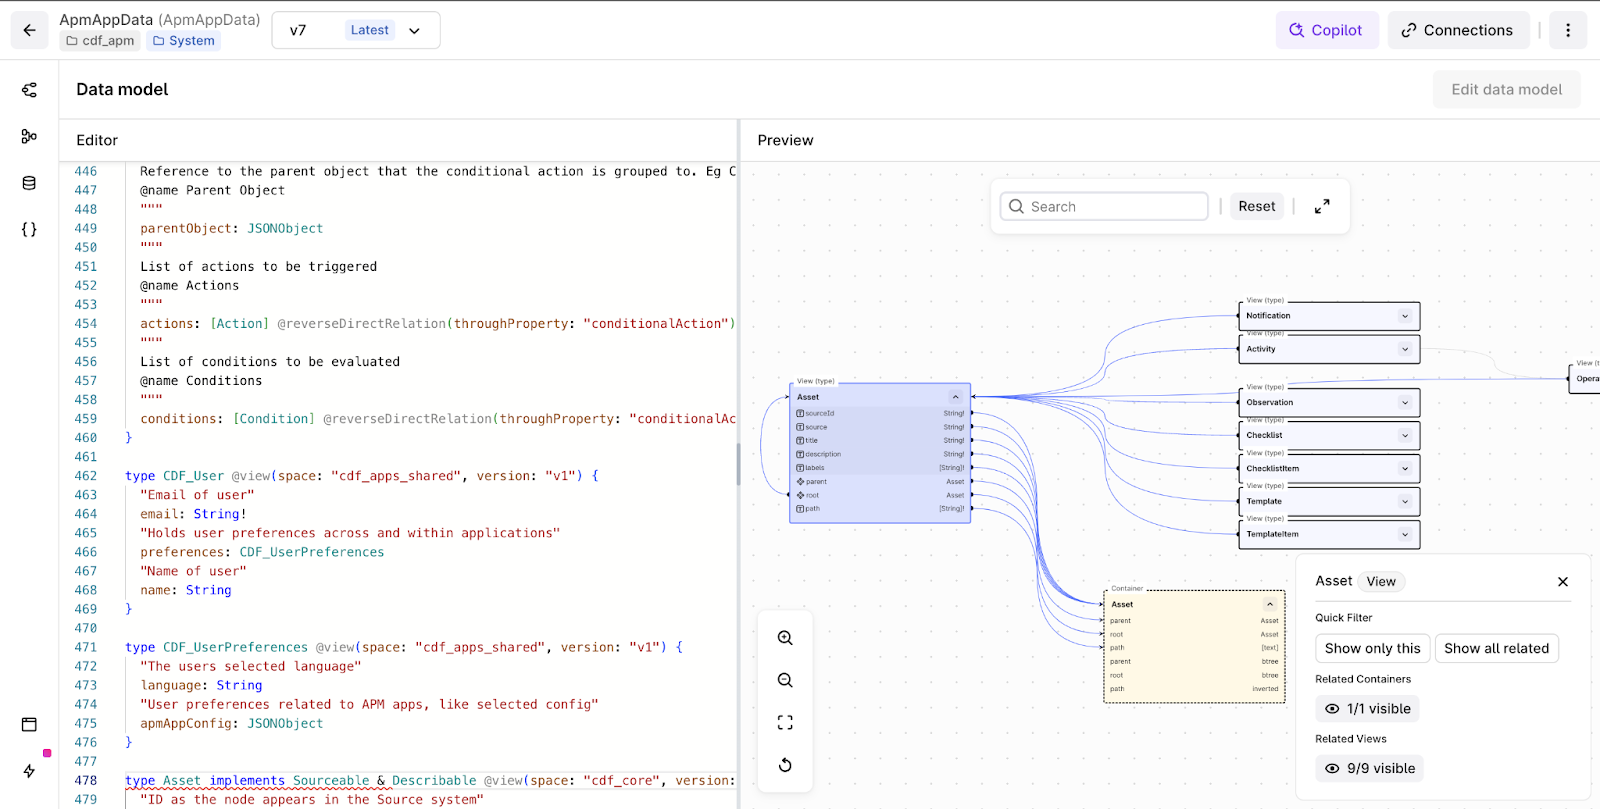
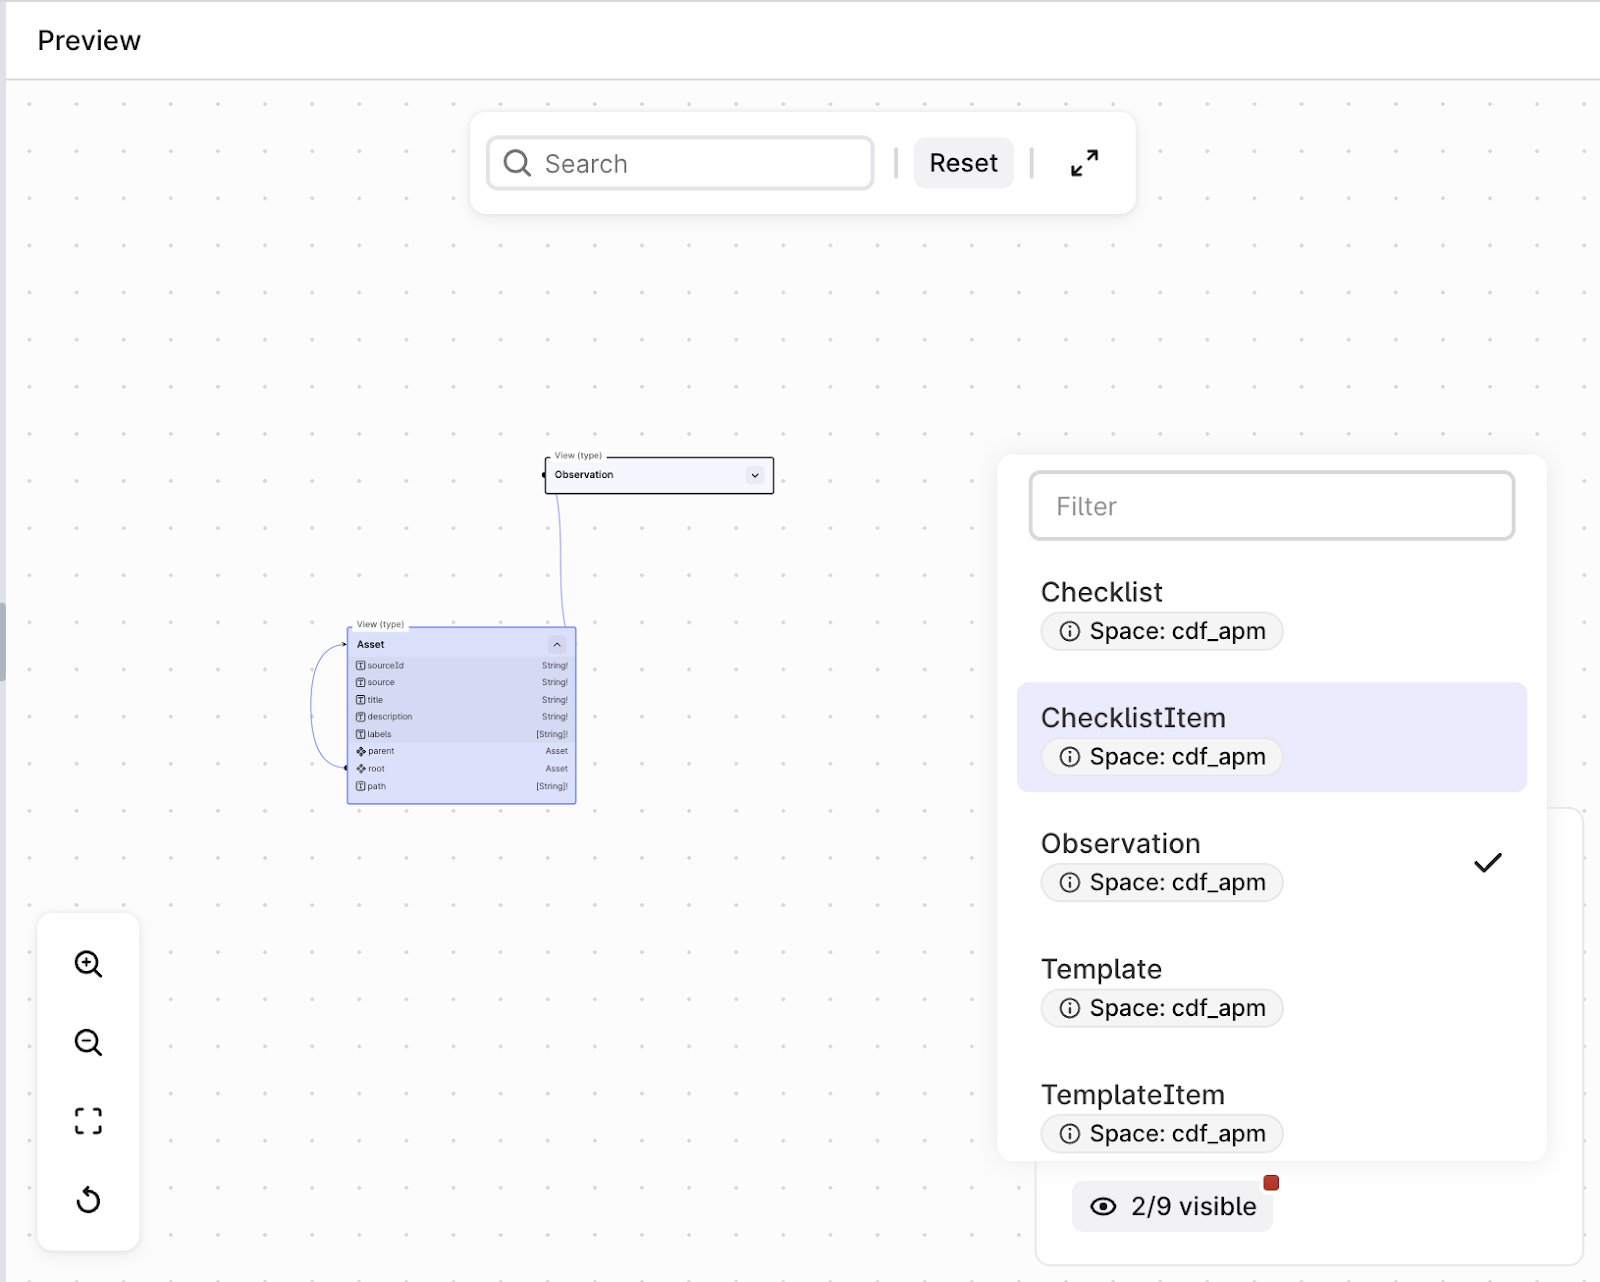
You can then further decide which related views and containers to be visible for the selected view or container.
You can click “Reset” at the top in the search bar when you want to go back to the original layout when the page first loaded.
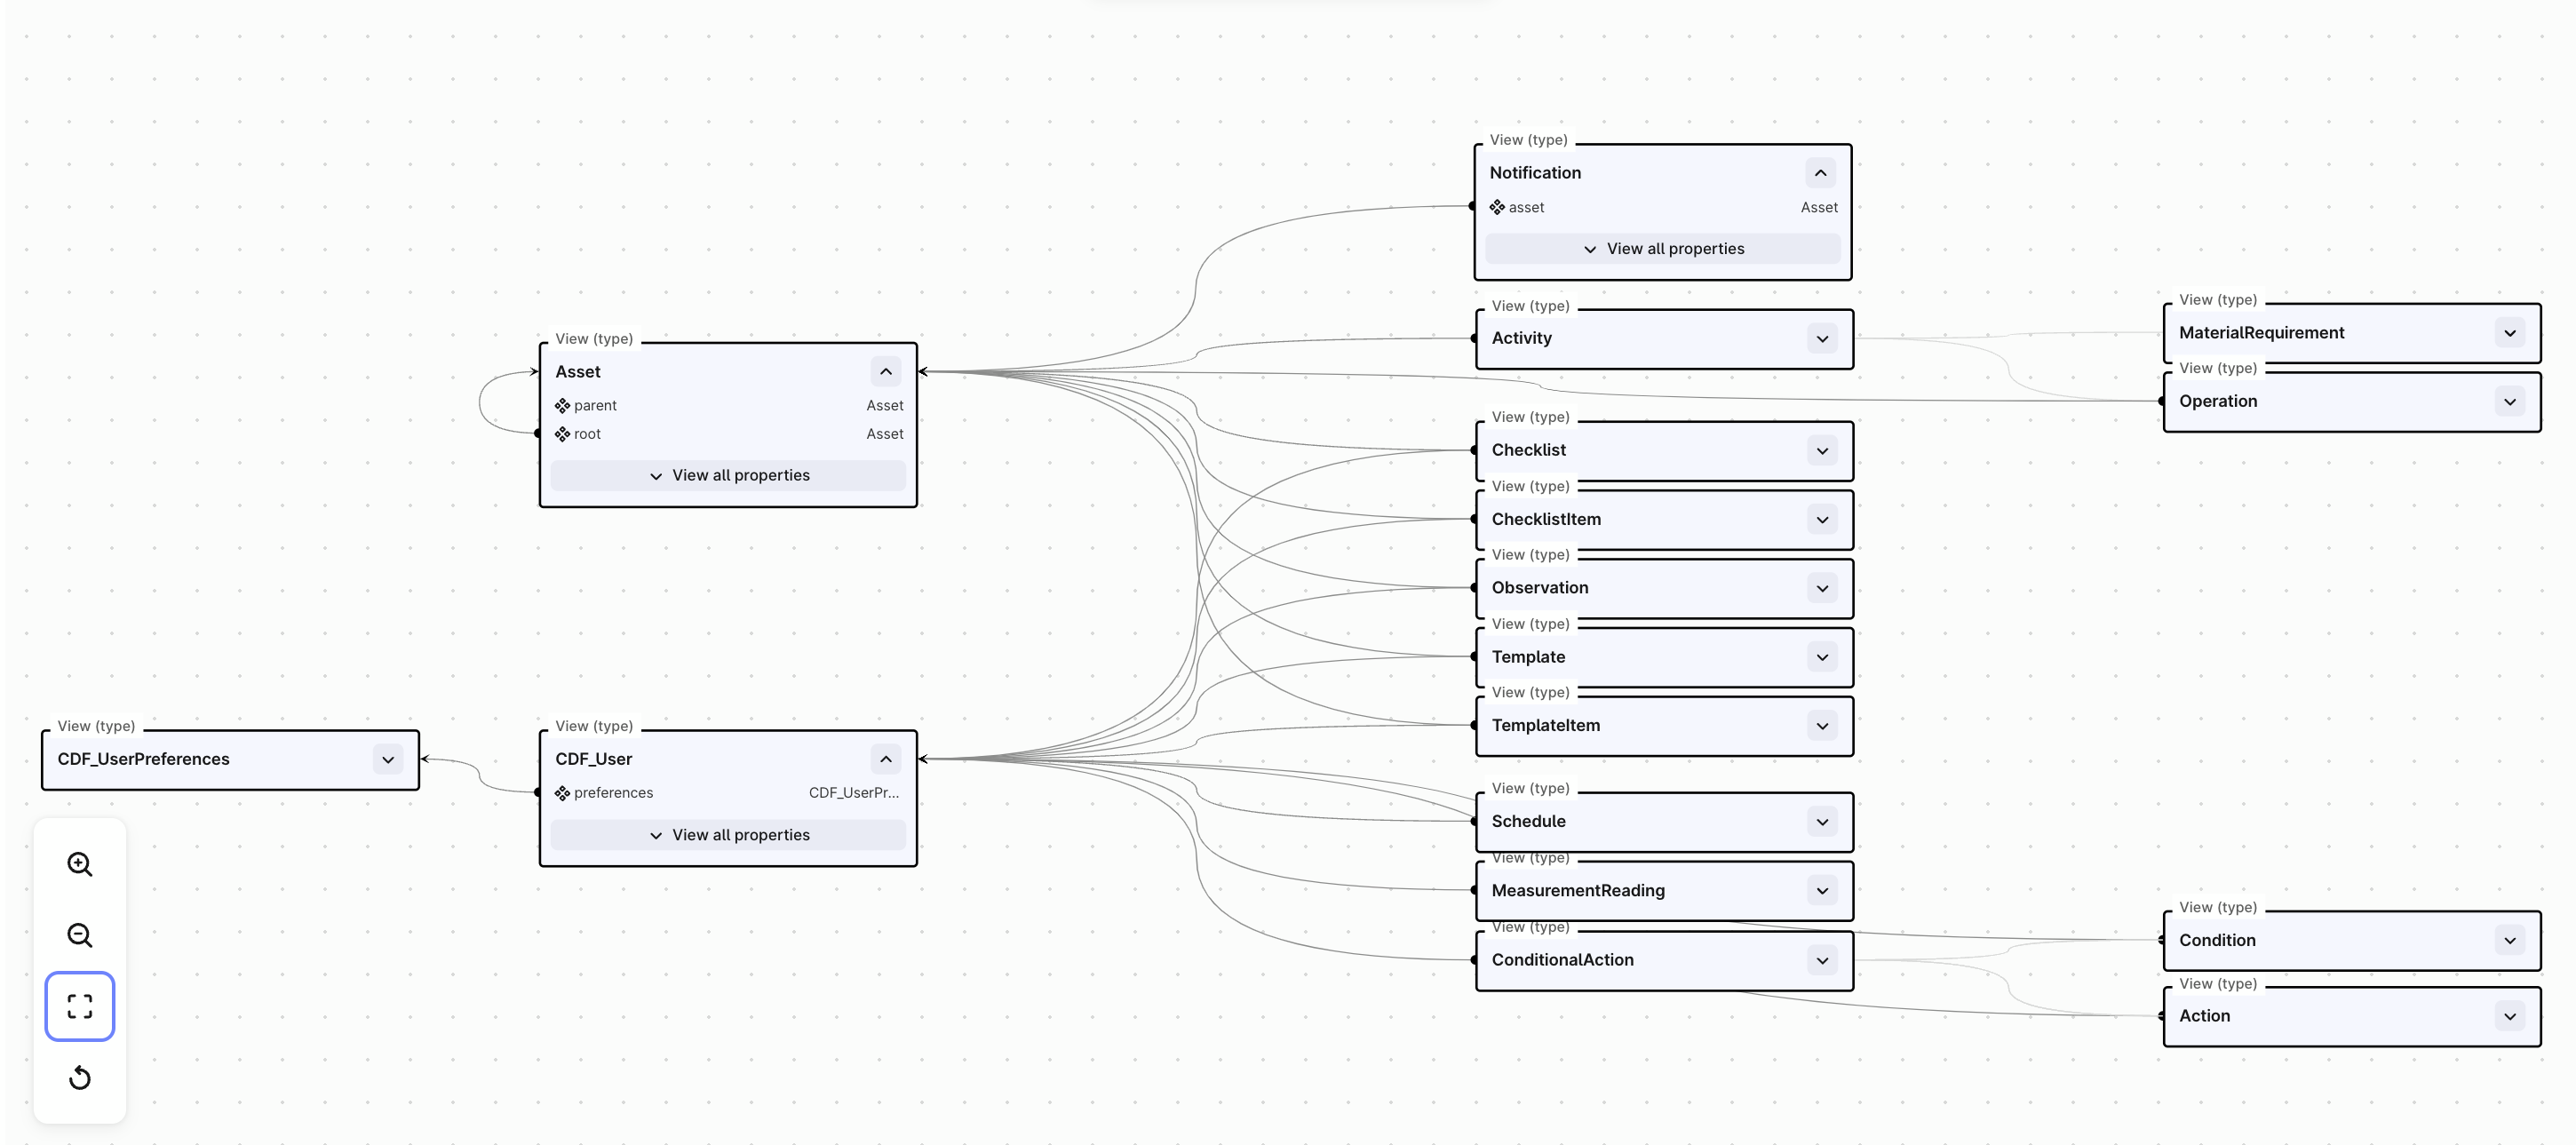
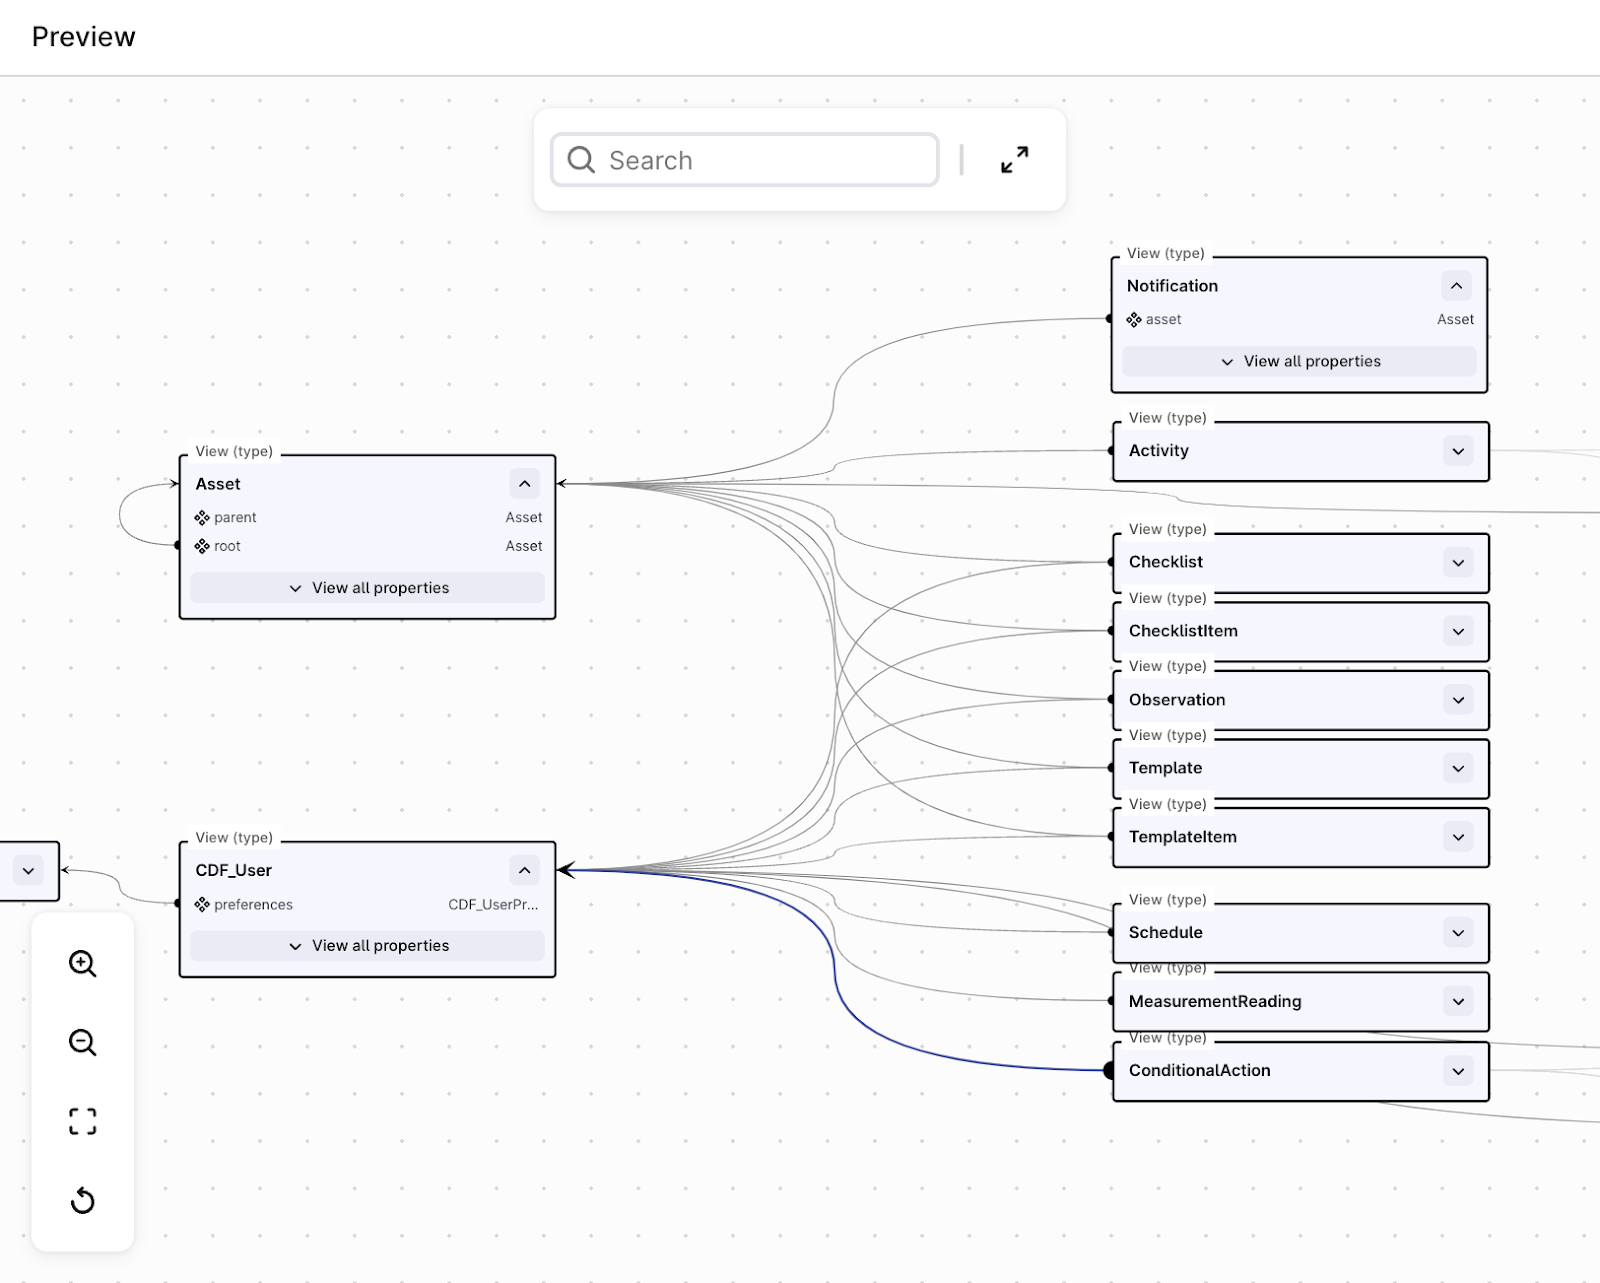
Clearer relationships visualization
Visualizing relationships are clearer for self referencing relationships. As well, arrows clearly identify the direction of a relationship (circle indicating source, arrowhead indicating target)
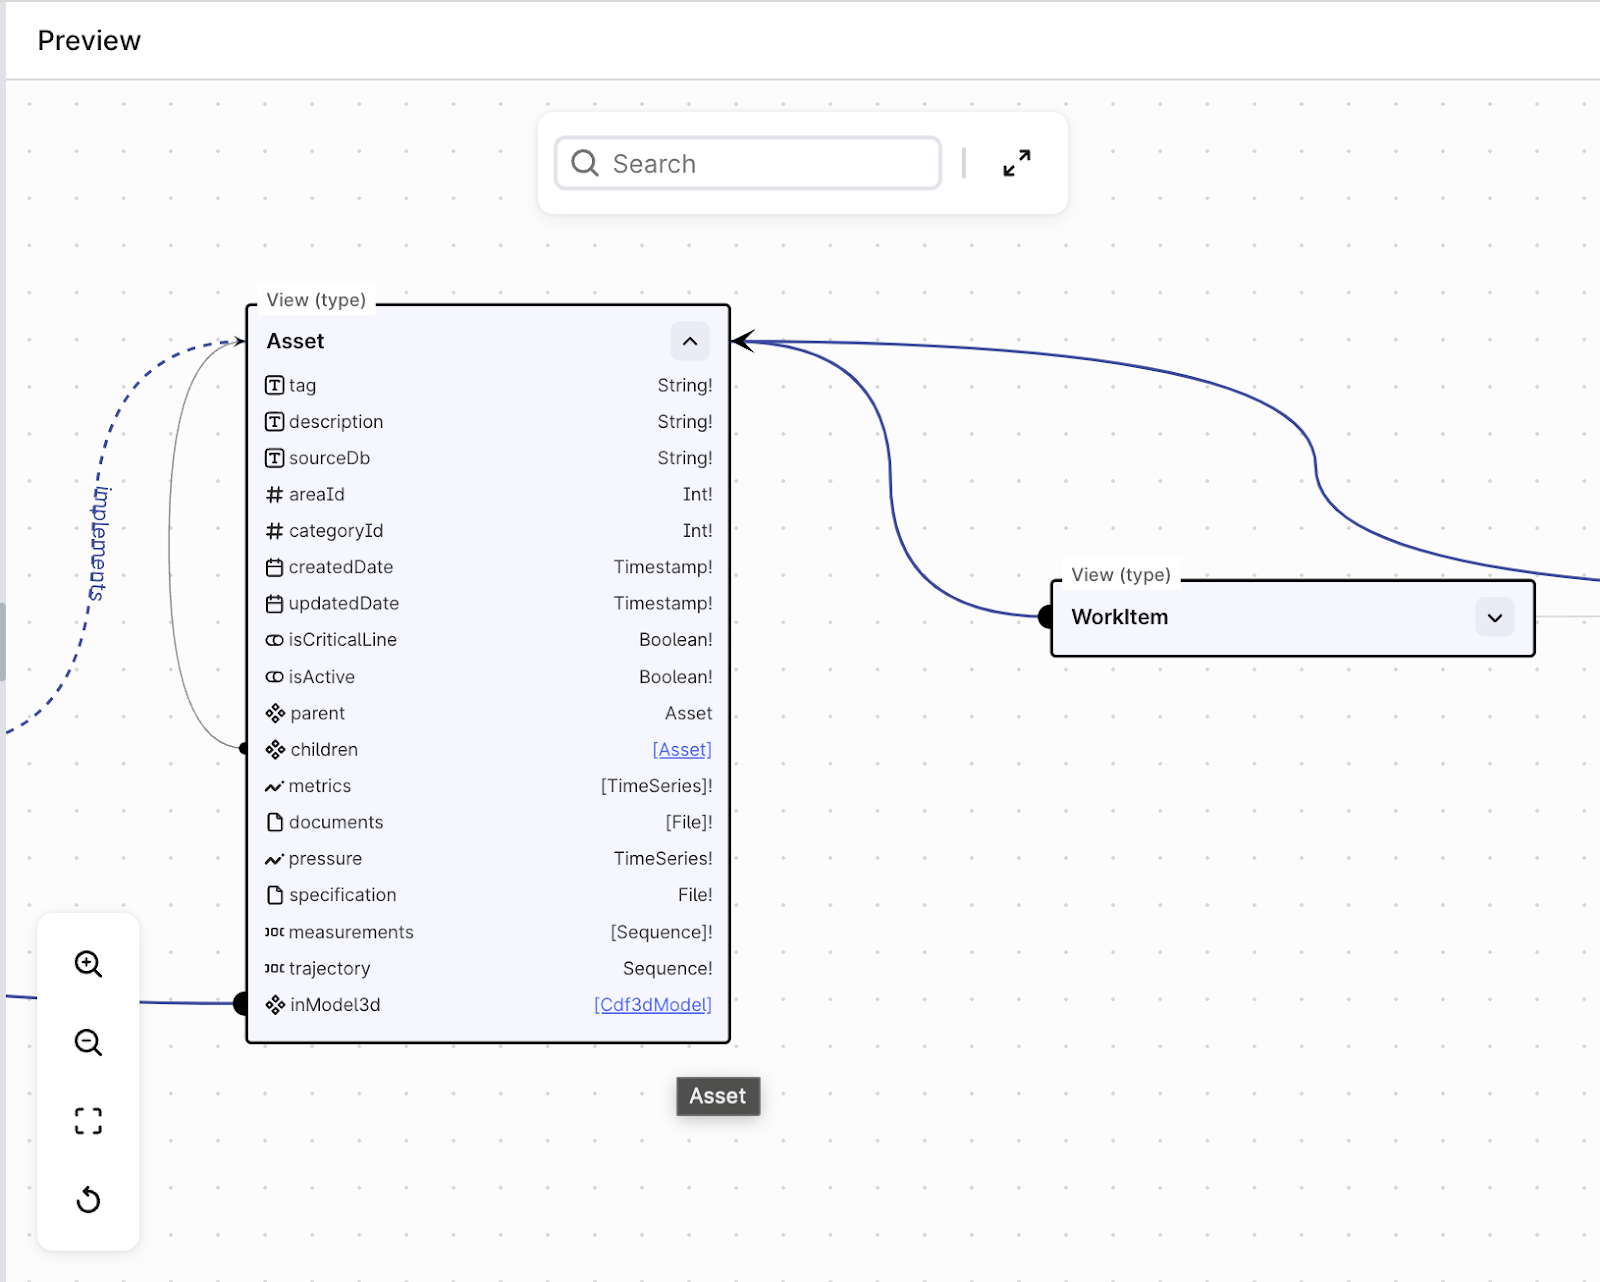
As well, there is a simple way to expand an item to just see the relational properties (edge or direct relations), without seeing all properties.
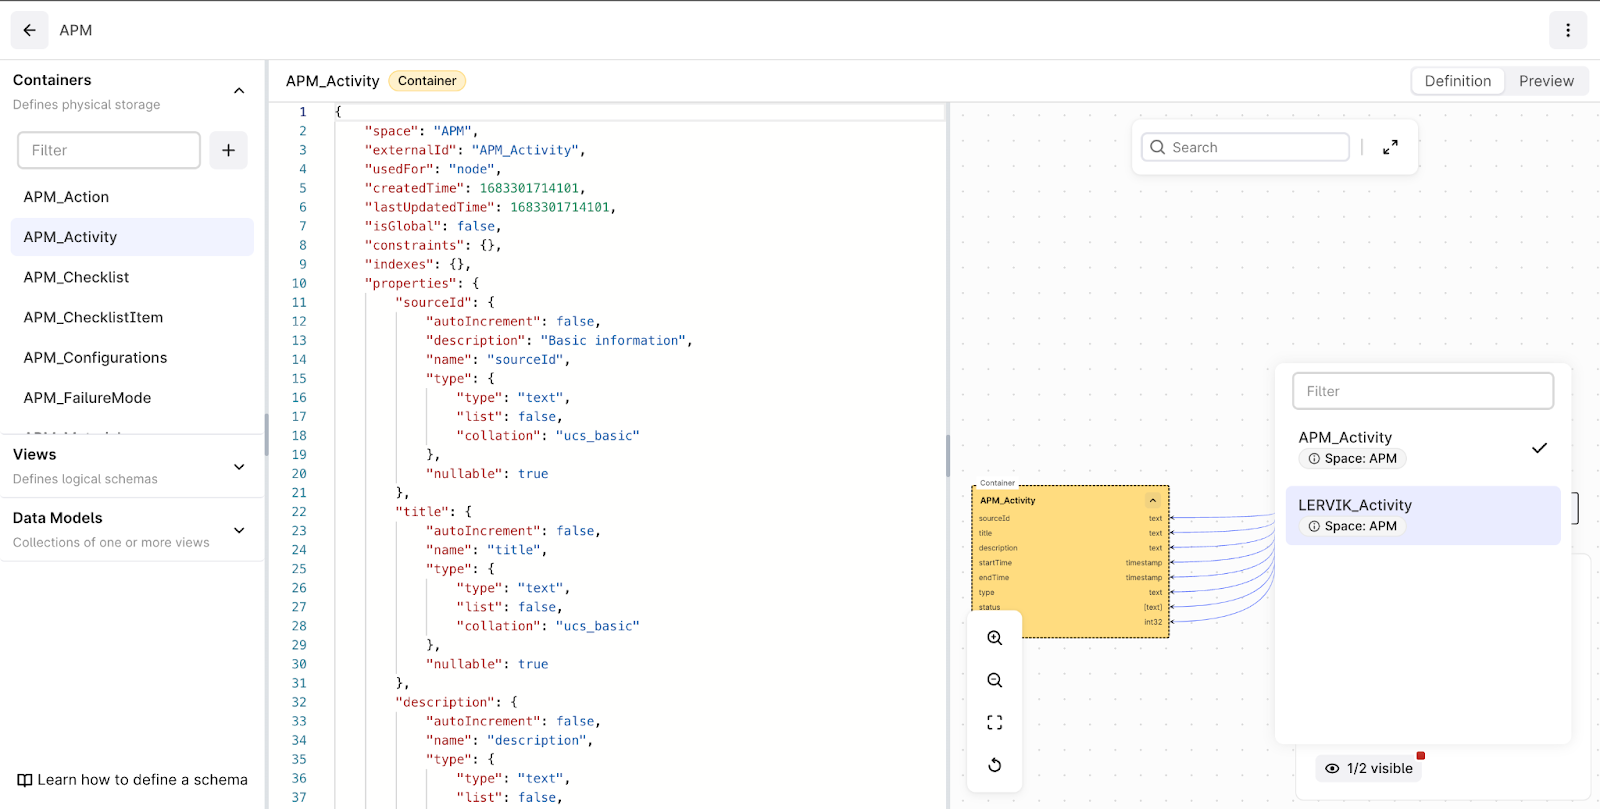
Identifying all Views that is powered by a Container
When choosing to view containers within a space, the selected container will list all the views that use the selected container.
As part of the release, we have also added or fixed the following:
- Data management - displays data from reverse direct relations
- General - all spaces, containers and views are displayed, instead of just the first 1000
