Check the
documentation
Check the
documentation Ask the
Community
Ask the
Community Take a look
at
Academy
Take a look
at
Academy Cognite
Status
Page
Cognite
Status
Page Contact
Cognite Support
Contact
Cognite Support

Today, we are happy to announce the release of the following improvements to Cognite Data Fusion (CDF).
Manage RAW foreign table in the Postgres Gateway
You can now manage the RAW foreign table in the Postgres Gateway using APIs and don’t have to rely on external tools such as pgAdmin or psql CLI to create, list, update or delete the RAW foreign tables.
Update labels on assets
To make it easier to update labels on assets, we have added a set method in the updateAssets operation. The operation accepts a list of labels to set or replace for the resource.
Update sequence configuration
With the availability of mutable sequences, you can now update an existing sequence configuration. In addition to adding, removing and updating columns in your sequence, you can also update or clear the assetId, externalId, metadata, and the dataSetId for a sequence. To update a sequence, you need sequencesAcl:WRITE capabilities.
Group limits
To support authentication for users who are members of a large number of Azure AD groups we have increased the default group limit token configuration to 1.000 for new CDF projects with AAD as the IdP from now on.
Interactive engineering diagrams
We’re hard at work putting the final touches on our new user experience for working with interactive engineering diagrams. Stay tuned for the upcoming release.
Cognite Charts
Release Highlights
The main new features in this Cognite Charts release are:
-
Search for time series data by time series ID
-
Highlights matches in search results
-
Recently viewed tags and time series are displayed in the search panel
-
Merge y-axes with the same units
-
Show/hide min/max bands
-
Show/hide gridlines
-
Backend performance improvements
-
Bug fixes & UI/UX improvements
Search for time series data by time series ID
We have added a tab in the search panel to search for “Time series ID,” specifically. This tab should be used when you know the name of the time series you are searching for (e.g. VAL_21_PT_1019_04:Z.X.Value), while the “Tag number” tab should be used to search for the asset tag to which the time series of interest is related (e.g. 21PT1019). You will also notice that search results that match your query are now highlighted to make direct matches easy to see
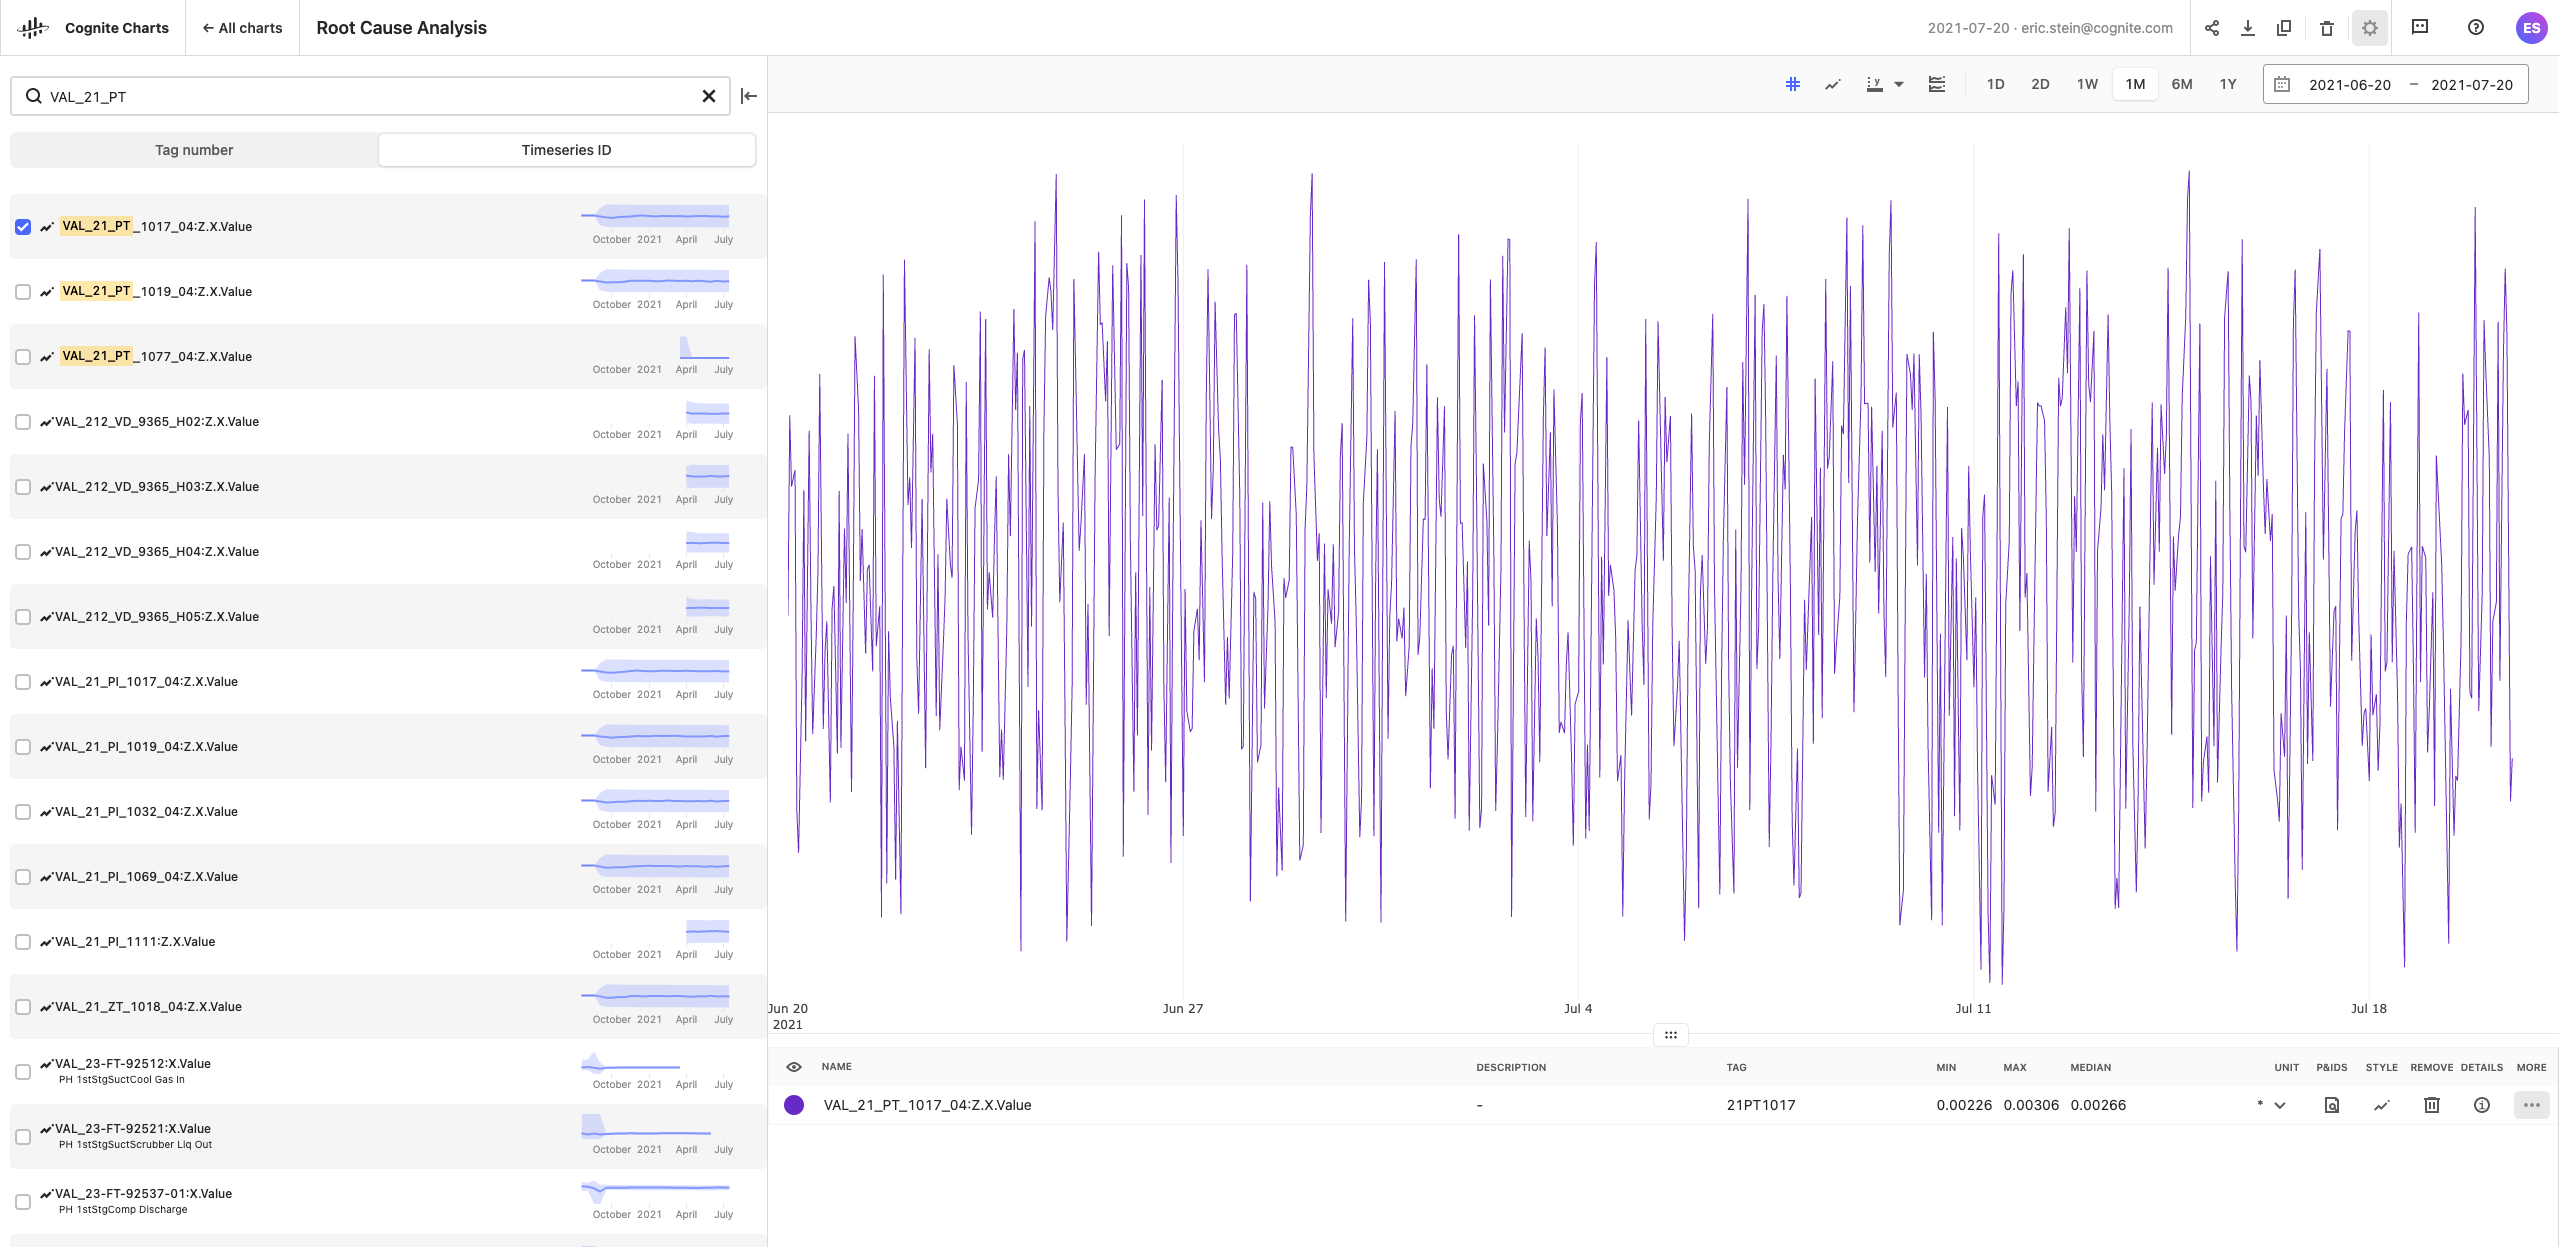
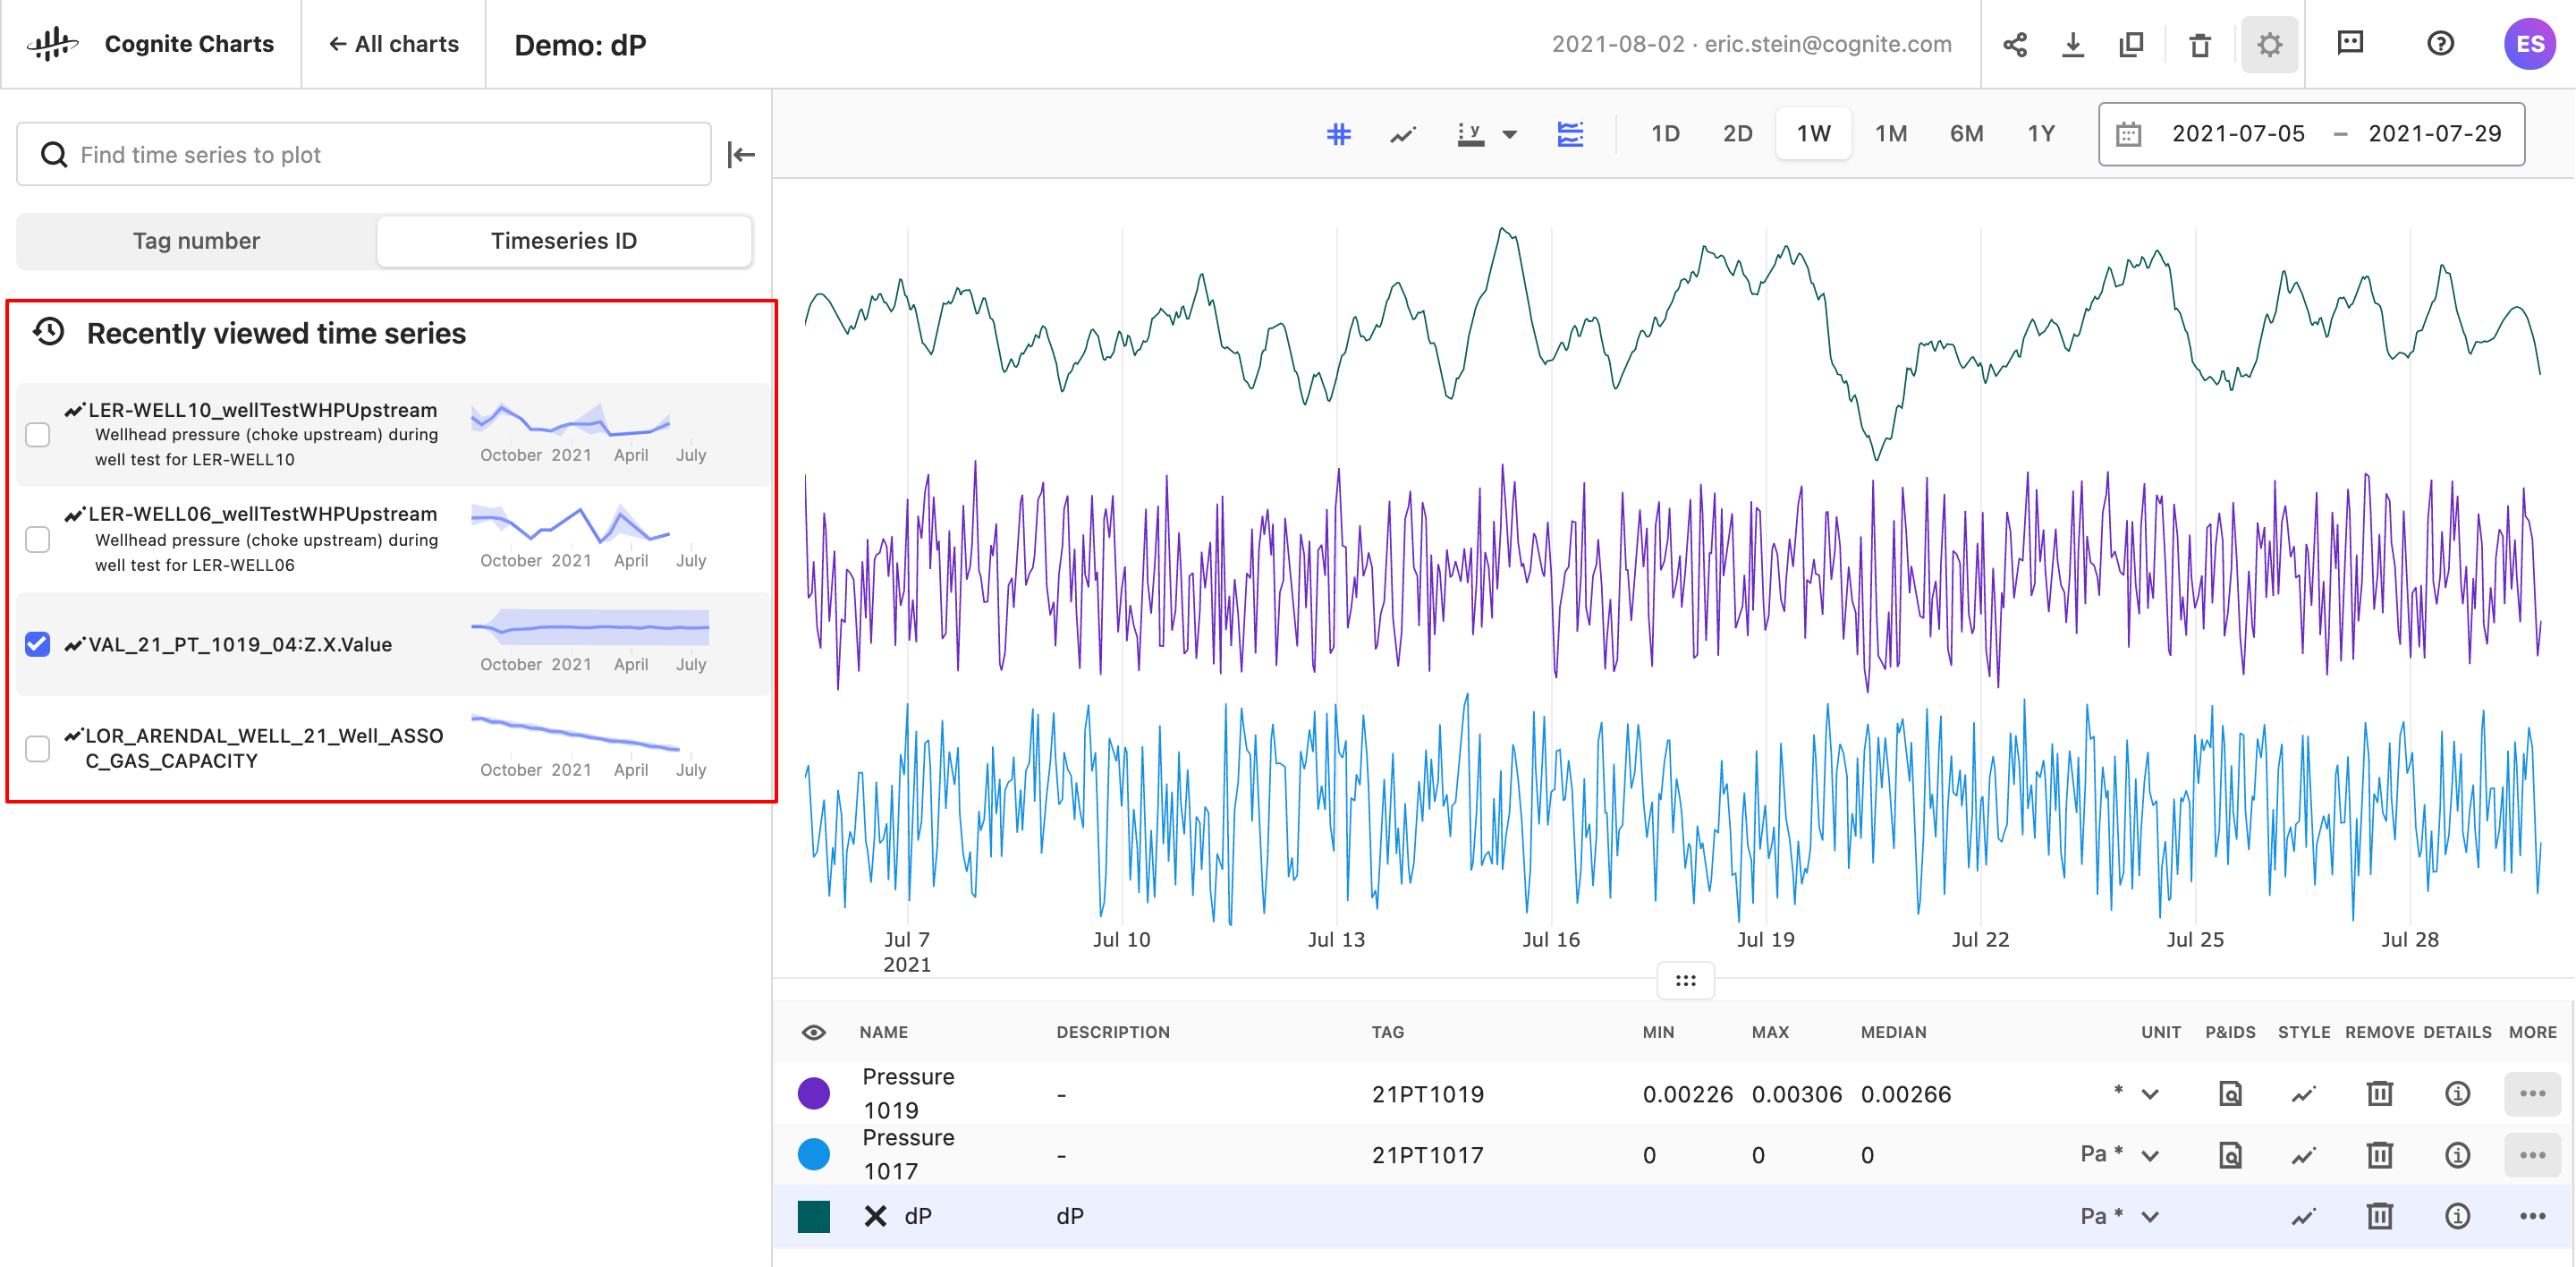
You’ll also see the tags (assets) and time series you have recently viewed (added and/or removed from your chart) in the search panel, if you have not begun to type a search query.
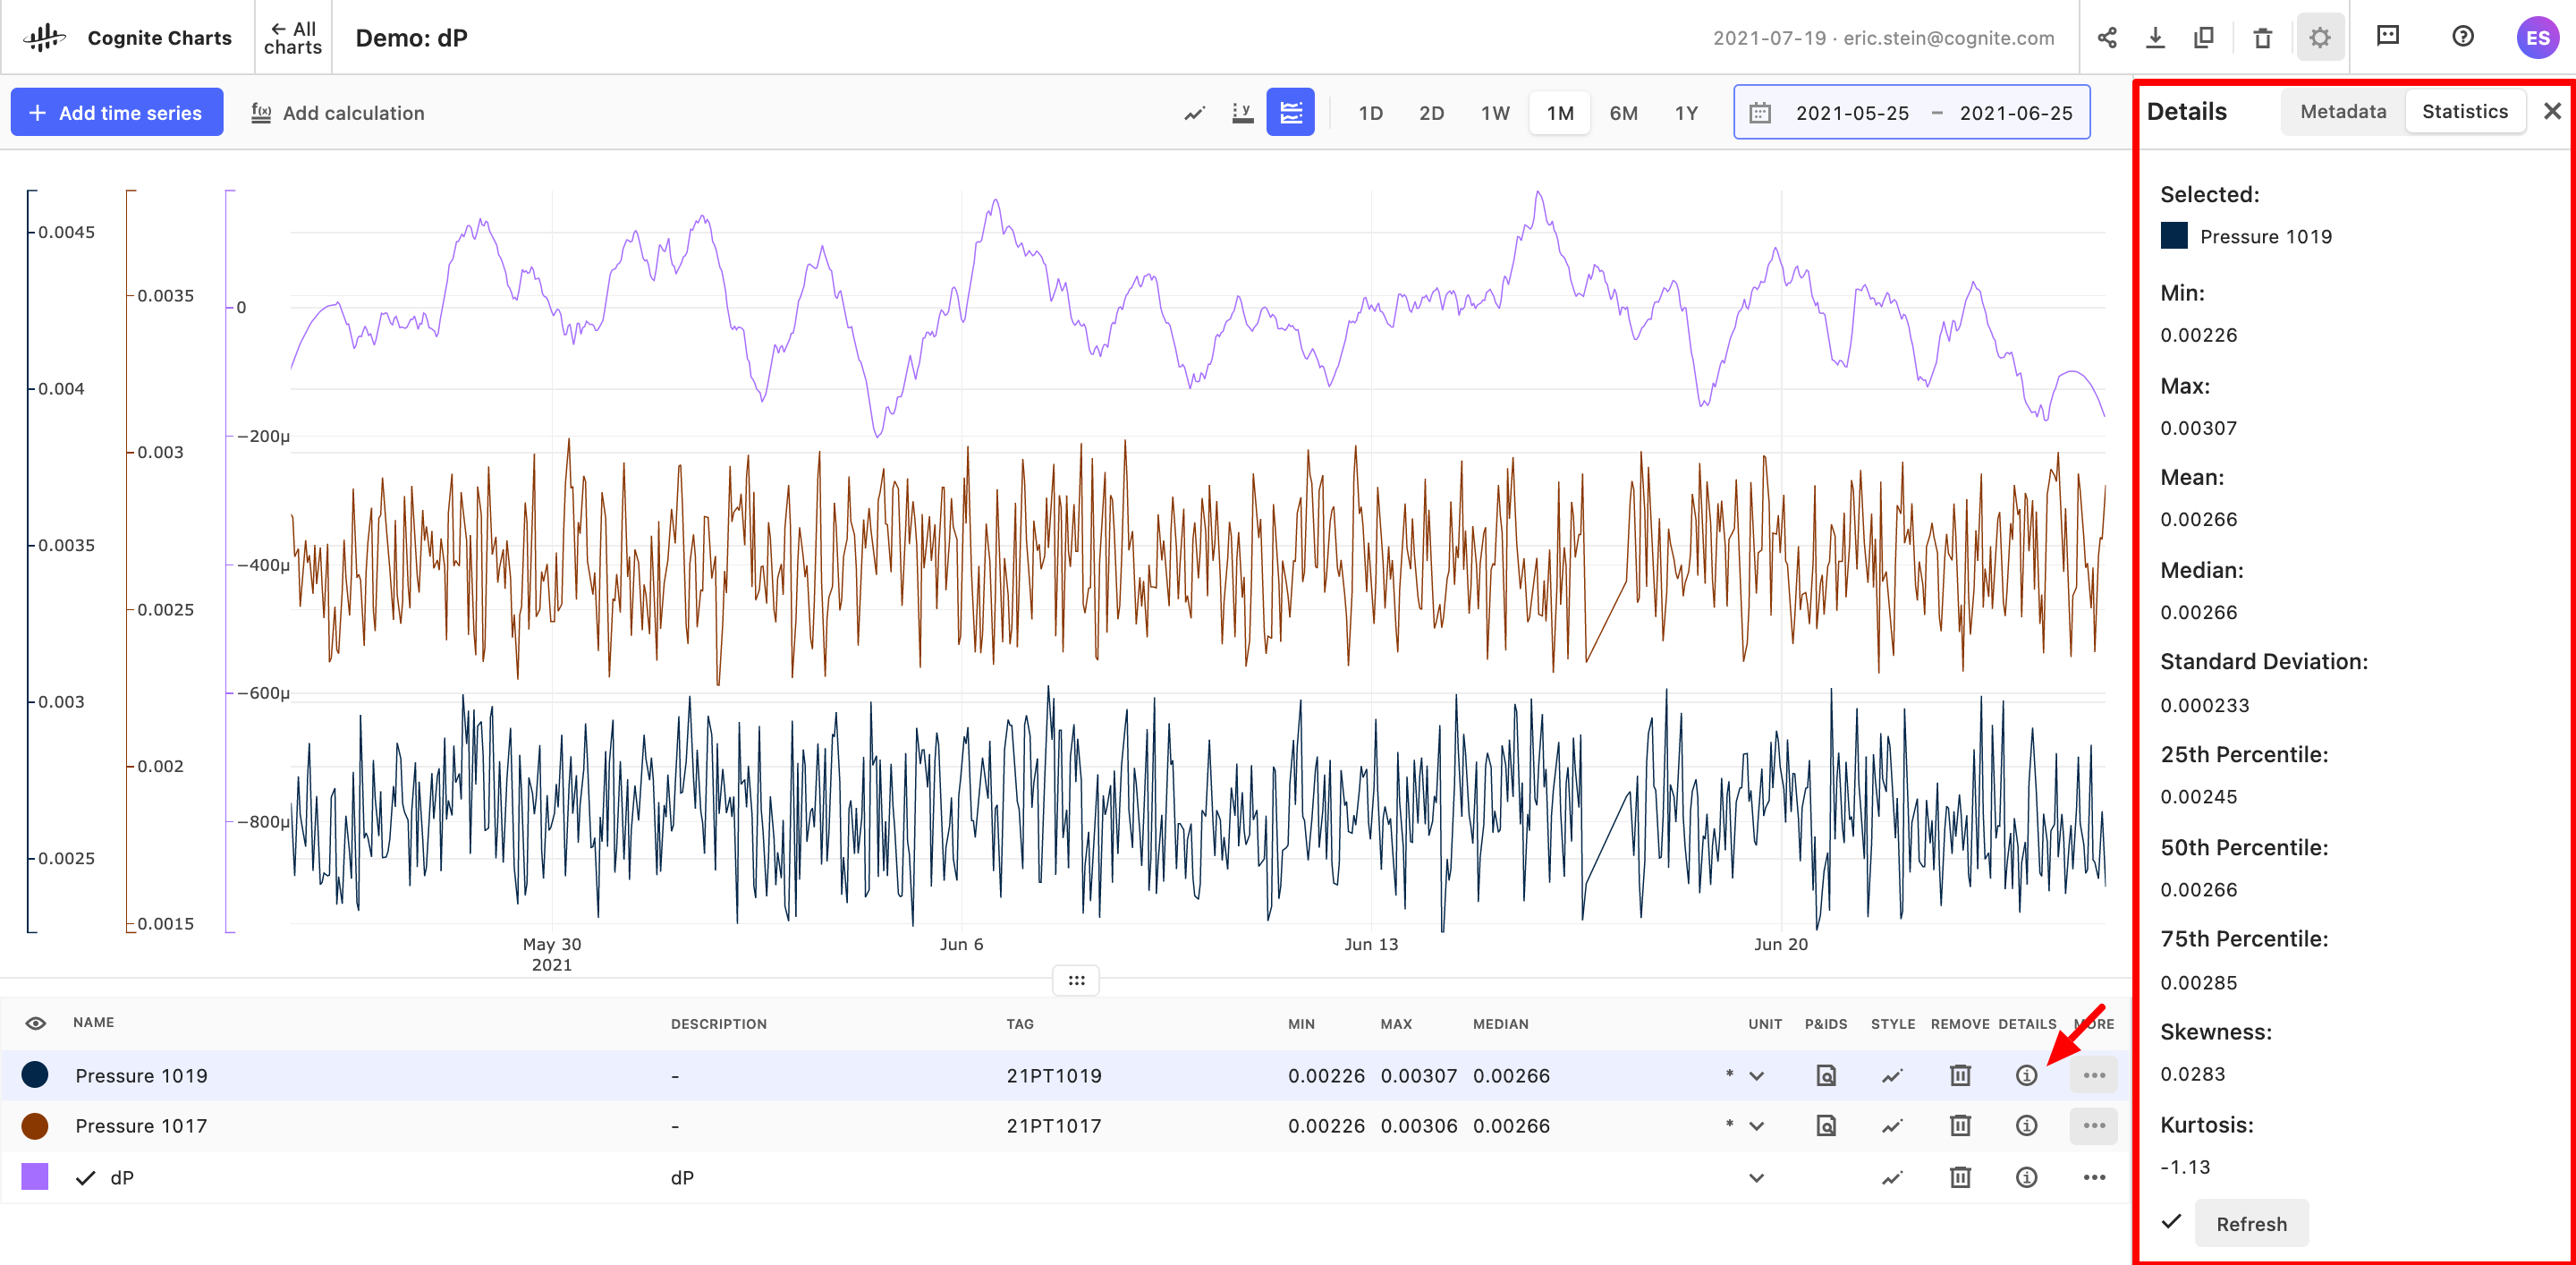
Basic Statistics & Tag Metadata
Users can view additional basic statistics (mean, std. dev., etc.) for the a given time series for the time range they’re currently viewing in the chart by clicking on the corresponding information icon. By clicking on the “Metadata” tab in this panel on the right-hand side of the screen, can view the metadata information for that
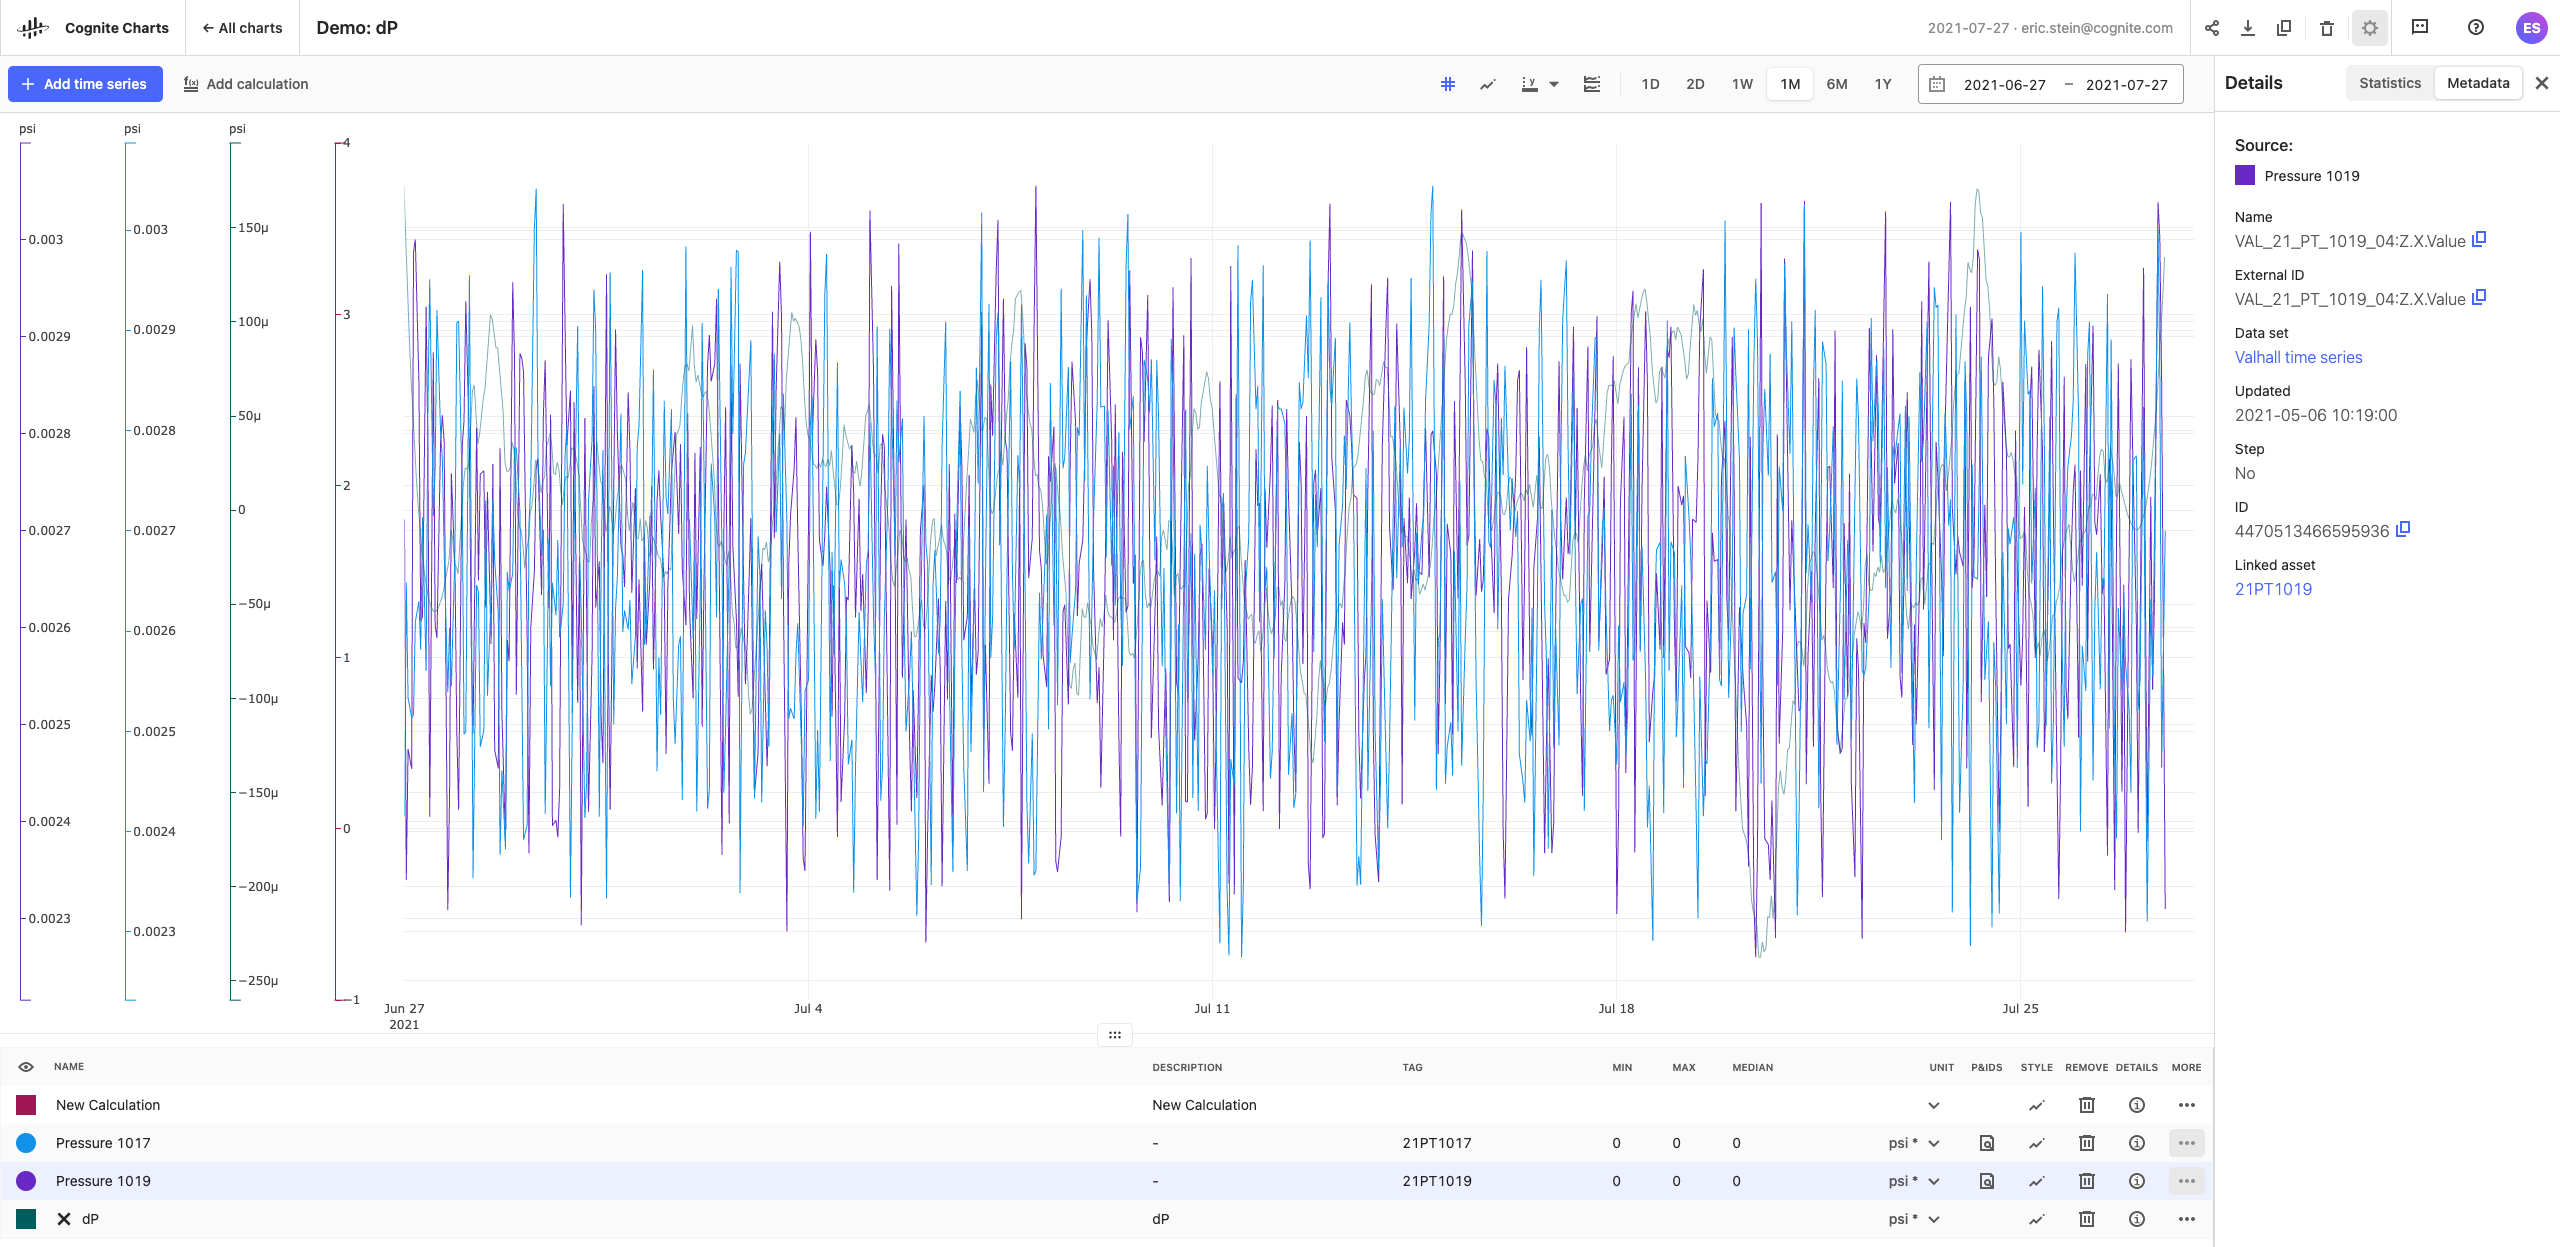
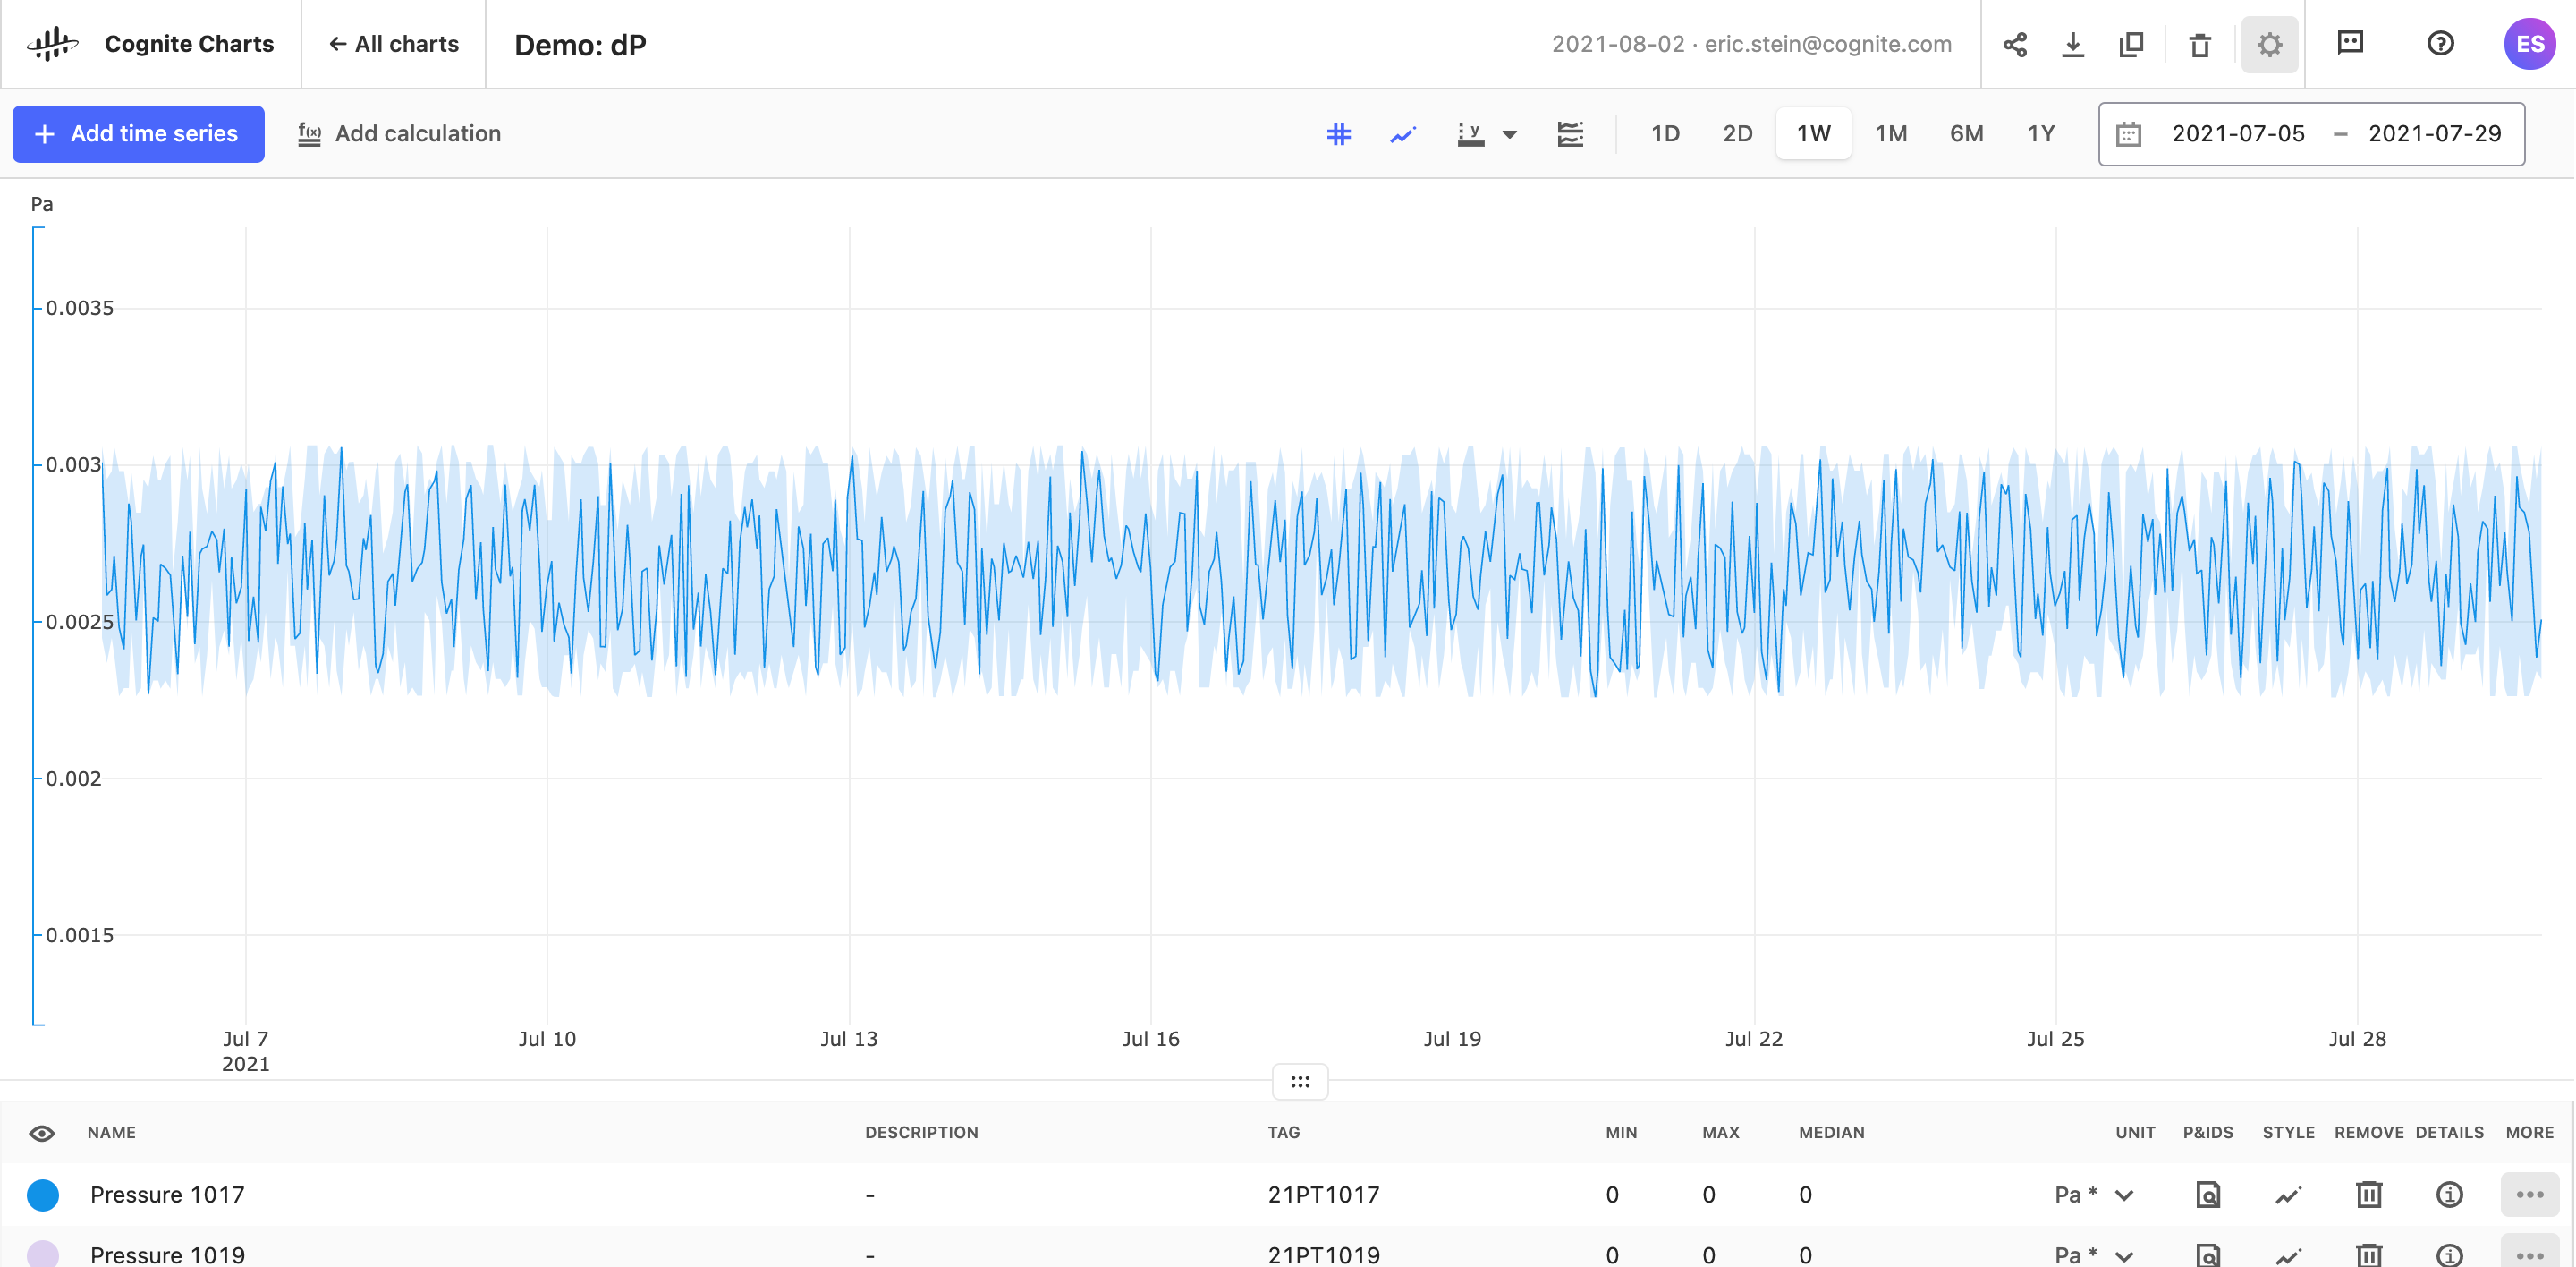
Merge y-axes with same units
It’s now possible to easily compare the values of two or more time series or calculations that have the same unit, without needing to manually match and align the axes individually. Simply click the y-axis button found just above your chart and select the “Merge units” toggle. In order for this feature to work, you must have already assigned the input and output units on the time series or calculation(s) of interest.
Show/hide min/max bands
While looking at a wider range of time, Charts will show the aggregated values for a given time series. With the min/max bands, it’s possible to visually display the min and max range for a time series.
Show/hide gridlines
Gridlines can be a valuable way to visually identify time series values, but they could also get in the way and be confusing when you have a lot of time series data on your Chart. Use the show/hide gridlines toggle to decide for yourself whether or not you want them displayed on your chart.