

 Check the
documentation
Check the
documentation Ask the
Community
Ask the
Community Take a look
at
Academy
Take a look
at
Academy Cognite
Status
Page
Cognite
Status
Page Contact
Cognite Support
Contact
Cognite Support


Hi,
Is it possible to display stepwise connection between datapoints in Charts rather than the standard linear interpolation?
Thanks!
Hi,
Is it possible to display stepwise connection between datapoints in Charts rather than the standard linear interpolation?
Thanks!
Best answer by Andrian Gasper
Hi Vetle.
If I understand you correctly, this should do it:
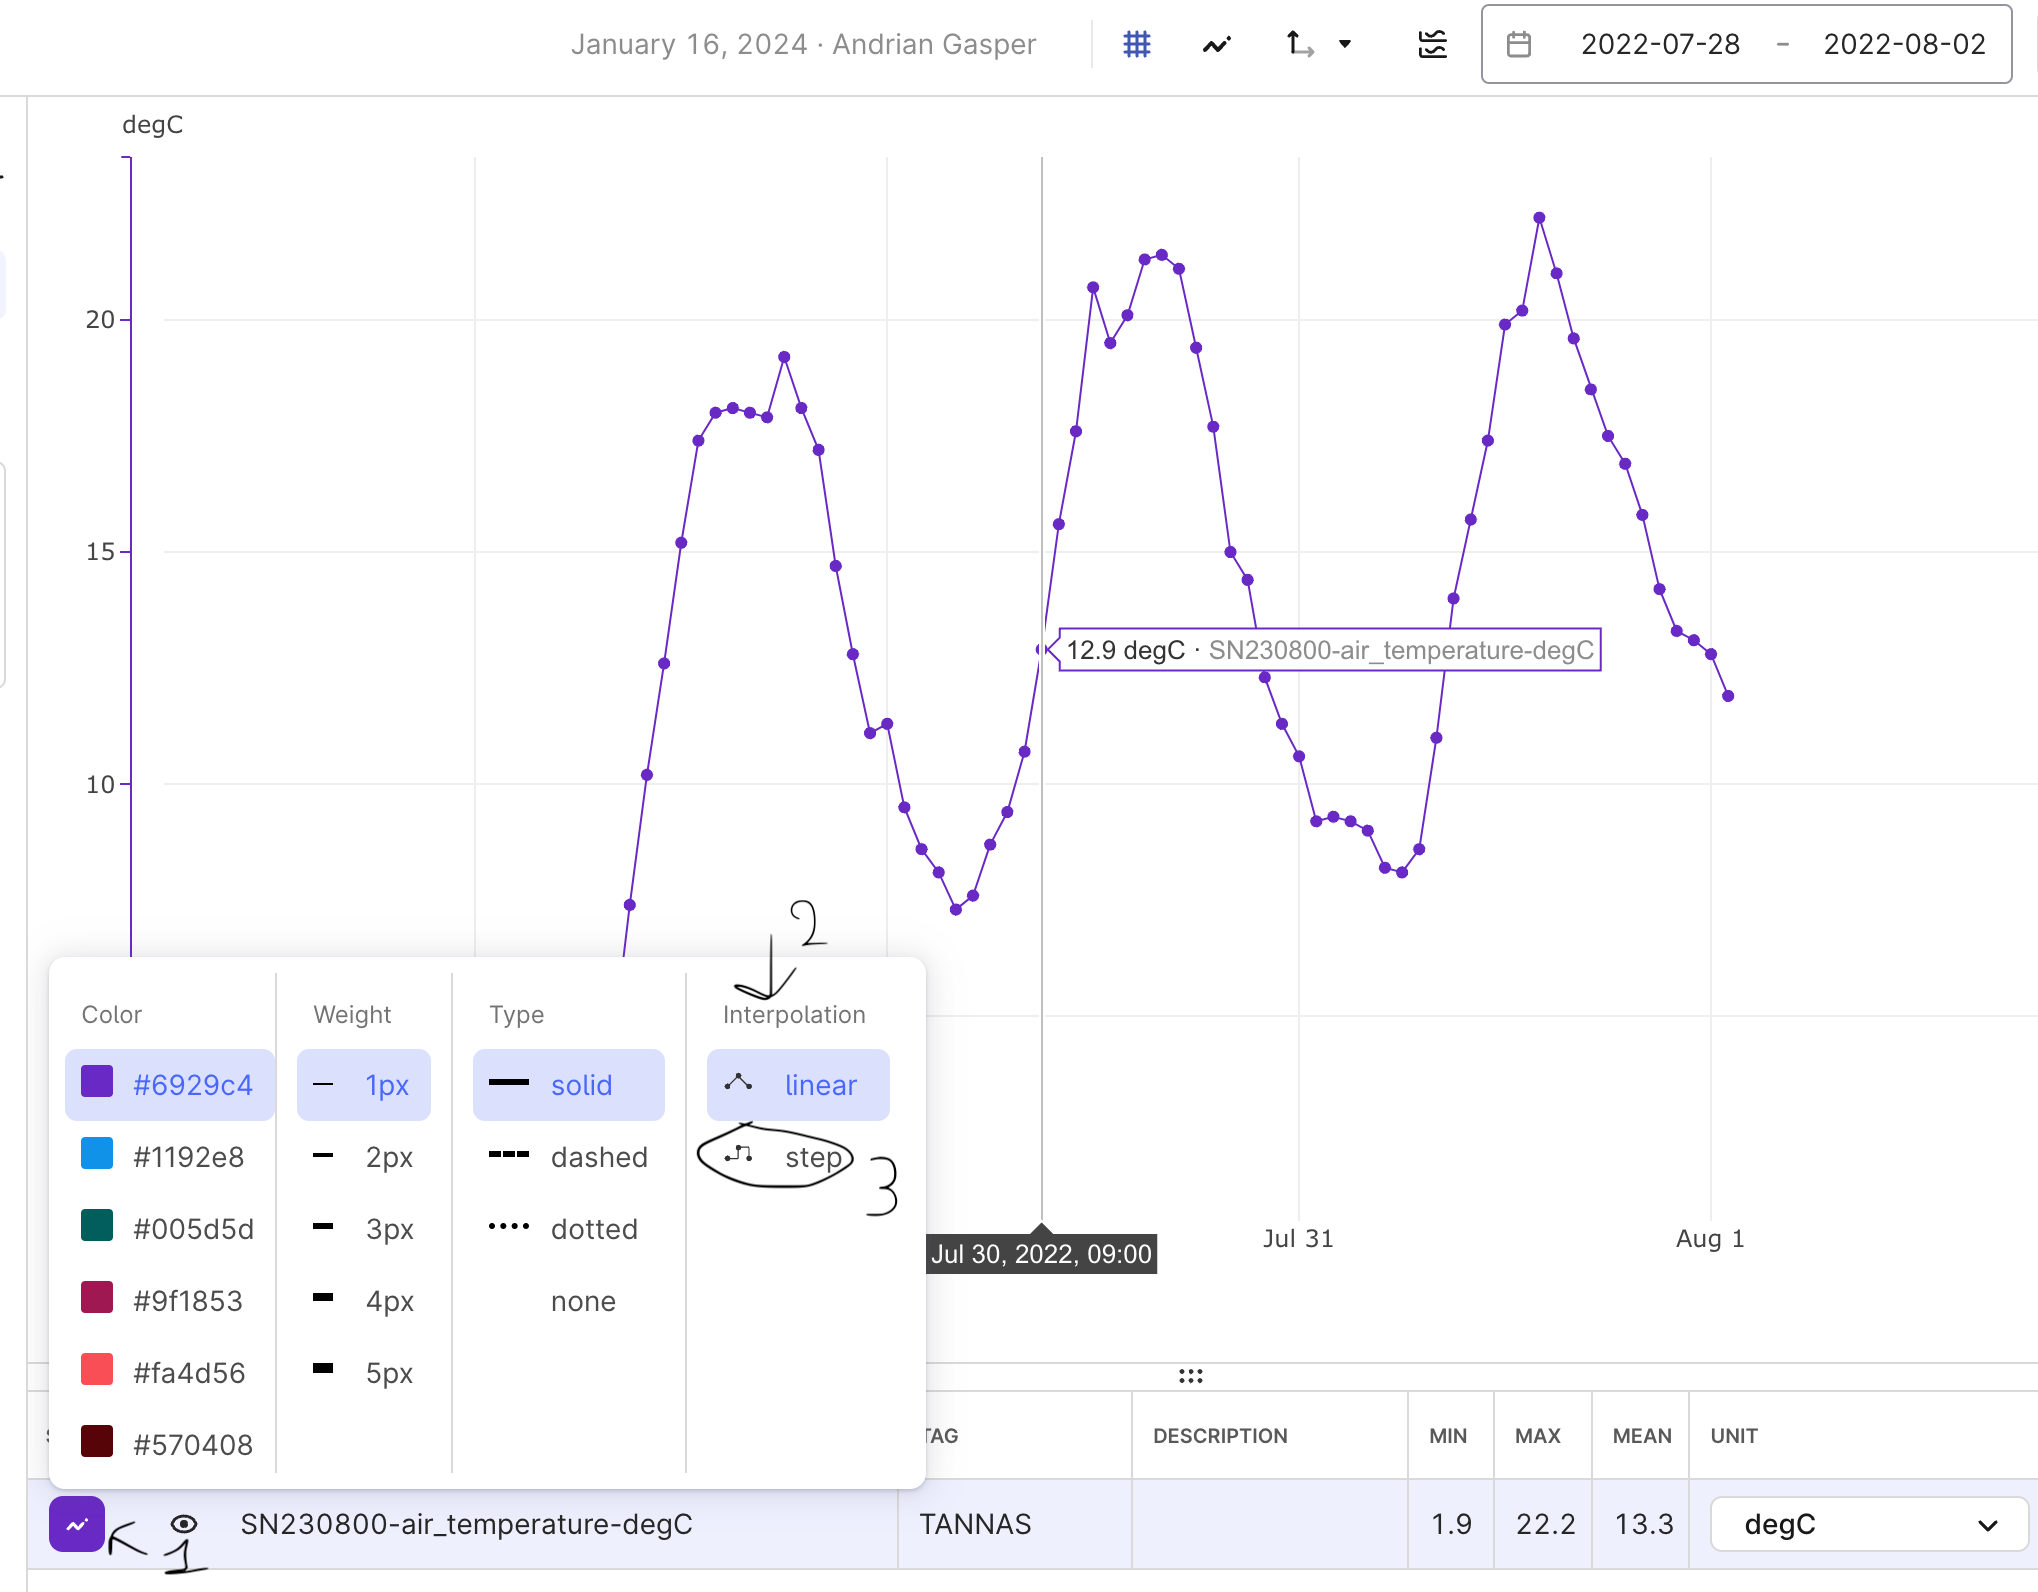
Let me know :)
Note: The data presented in this chart is from “cognite-learn” project.
Enter your E-mail address. We'll send you an e-mail with instructions to reset your password.

