Issue with Charts Events Feature

Related products: Charts


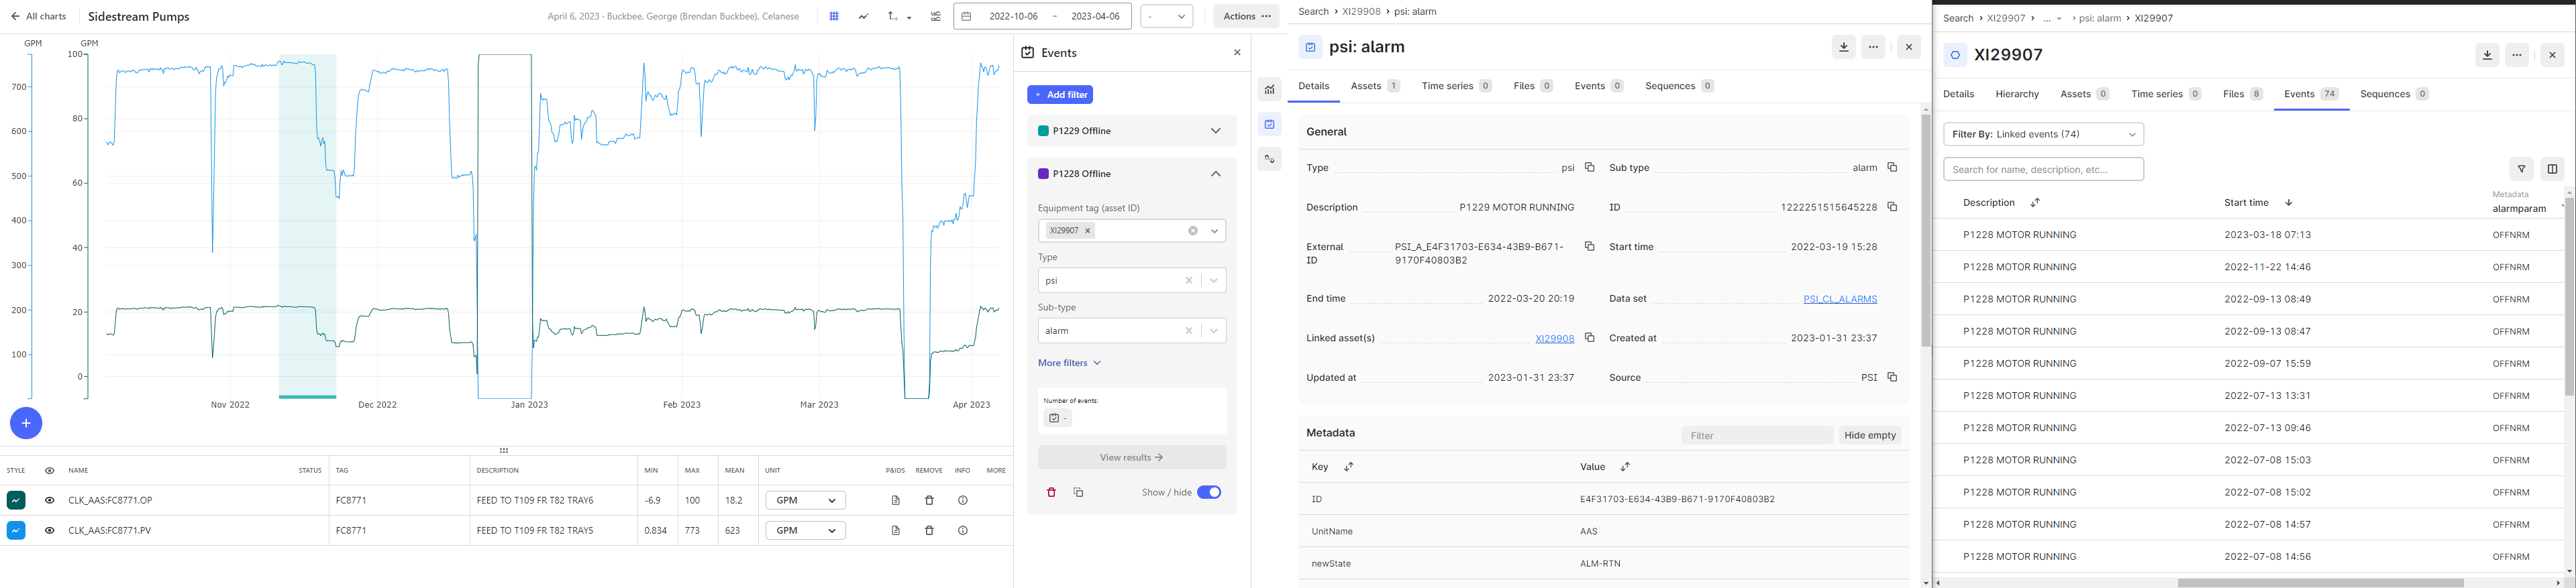
I’ve provided what should be a very clean visual explanation of the issues that I’m having. I’m trying to add events to my chart that indicate the run status of each pump in a system. I know the equipment tag of the pump I’m looking at and I have done manual CDF searches to find that the tag has events over the time range that I’m looking at. However, the query within charts returns no events. 

When I query the sister pump’s events, it identifies only 2 of the 3 events in the time frame, useful, but not enough to do what I need to do. 


Hi, Brendan. 

You should be able to see all the events here connected to the pump, with the start and end time within the time frame you are looking at. 

Thank you for both the description and the screenshots. Those are very helpful. Let us try to reproduce it and find out what is happening here. 

Knut Vidvei 


@Knut Vidvei  whats the update? This is critical for us


Hi, @Brendan Buckbee .


I’ve been able to reproduce on your exact data. The events you are looking for does not appear to have an end date, and with the current implementation it only shows events with both start and end date.

If you zoom out in time to a date when you have with end dates lower in the table below you will see those events in the chart.

We will create an update to Charts where events without end dates are still listed, and the start time will be visible in the graph as a line on the start time. And the events will be listed in the side panel.


Best regards, Knut


@ibrahim.alsyed This appears to be a data quality issue with the PSI data. We can’t have multiple instances of the same alarm active at the same time. Every alarm except potentially the current one should have an end date.


NewGathering Interest