

 Check the
documentation
Check the
documentation Ask the
Community
Ask the
Community Take a look
at
Academy
Take a look
at
Academy Cognite
Status
Page
Cognite
Status
Page Contact
Cognite Support
Contact
Cognite Support
In this post, I want to mention a tool that can help us troubleshoot issues such as authentication or unexpected errors: Fiddler
Fiddler is a Windows-only tool that logs HTTP(s) traffic. This will help you to understand what you are sending on the payload in the request and what response you are getting. This is a community-trusted free tool.
Some applications don't show descriptive error logs in the UI, which makes it challenging to narrow down the issue; however, you can get a better understanding of what is going on if you have visibility on the API calls.
When using a Web app in the browser, you can use tools such as the Network Tab in the Developer tools to capture the traffic and inspect the API calls. You can get more details on how to do this in this post:
But what do you do when you get errors in applications (.exe) such as Power BI, for example? For scenarios like this, you can use Fiddler.
How to use Fiddler
- Download and install Fiddler-Classic
- Open Fiddler
- You need to decrypt traffic to be able to see the body. For this, you will go to Tools → Options:
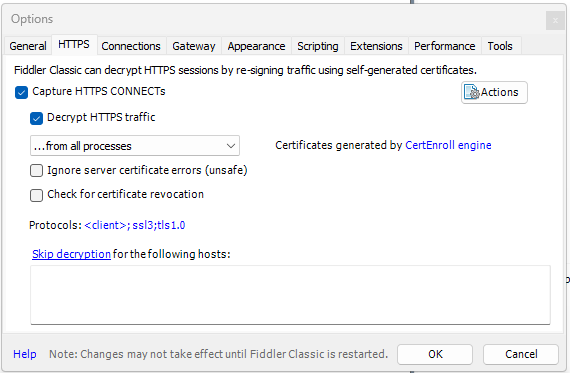
Configuration to Decrypt HTTPS
- Make sure in the down left corner it says it's capturing before reproducing the issue.
- Reproduce the issue.
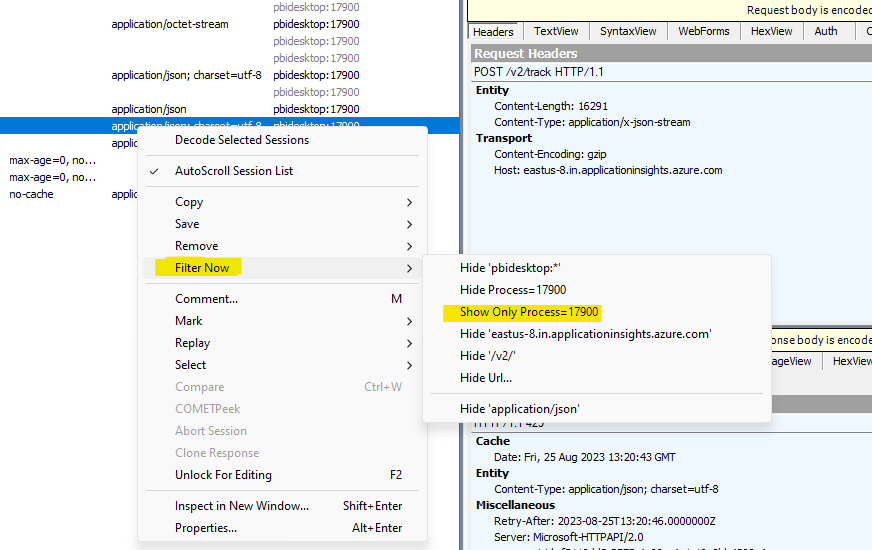
To filter down a process, you can find the API call you are interested in:
If you want to provide these logs to support, you can export these logs by going to File → Save, and choose between saving all the sessions or only saving selected sessions. This will produce a .saz file, which can be viewed with Fiddler.
Let me know what you think about this tool, and which other tool we should mention.
Maria Fonseca,
Technical Enablement Consultant.