Check the
documentation
Check the
documentation Ask the
Community
Ask the
Community Take a look
at
Academy
Take a look
at
Academy Cognite
Status
Page
Cognite
Status
Page Contact
Cognite Support
Contact
Cognite Support


Hey!
In our tooling for Power Analysts we compute synthetic-timeseries for them to evaluate scenarios of flow exceeding a threshold value.
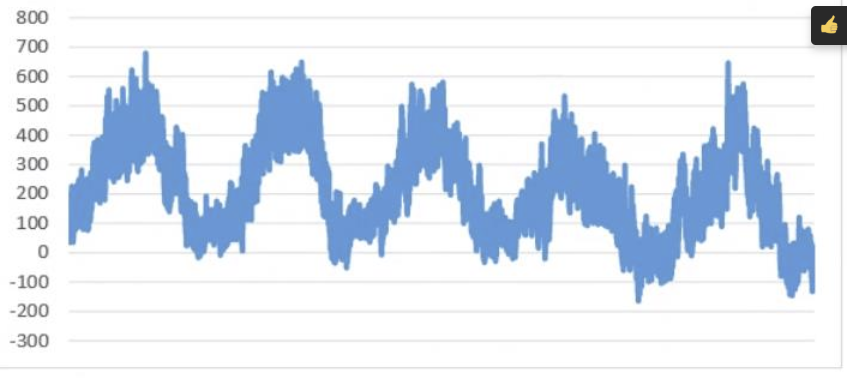
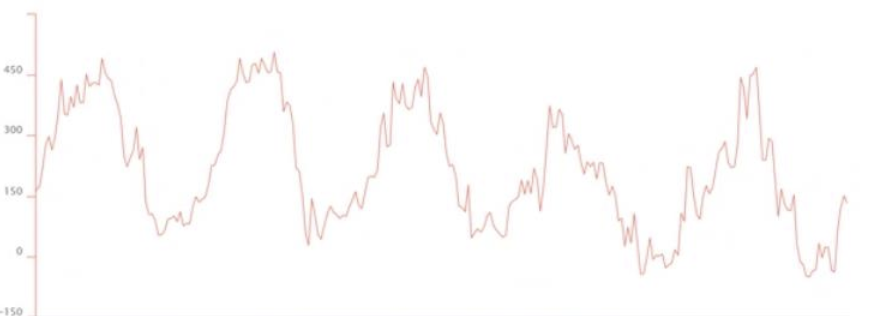
In the current implementation of SyntheticTimeseries only Average and Interpolation aggregates are allowed. This leads to scenarios where zoomed out (and down-sampled) views of data computed through the SyntheticTimeseries API displays non-informative values. Consider the example below, where the top image is the un-aggregated addition of two timeseries, and the bottom is with the use of SyntheticTimeseries.